


: �$B$3$NJ8=q$K$D$$$F�(B...
: proposal4-1
: �$B;29MJ88%�(B
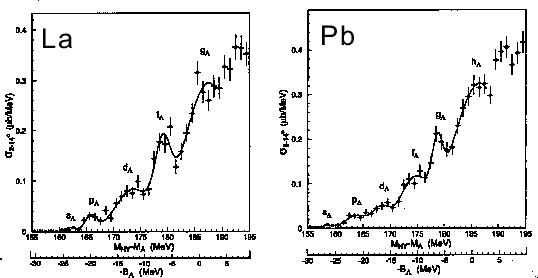
�$B?^�(B 1:
Excitation energy spectrum of
 La and
 Pb measured with the SKS
spectrometer of KEK-PS by the
Pb measured with the SKS
spectrometer of KEK-PS by the
 reaction.
 |
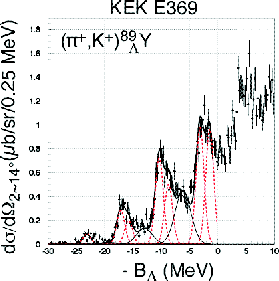
�$B?^�(B 2:
Excitation energy spectrum of  Y measured with the SKS
spectrometer of KEK-PS by the
reaction.
Y measured with the SKS
spectrometer of KEK-PS by the
reaction.
 |
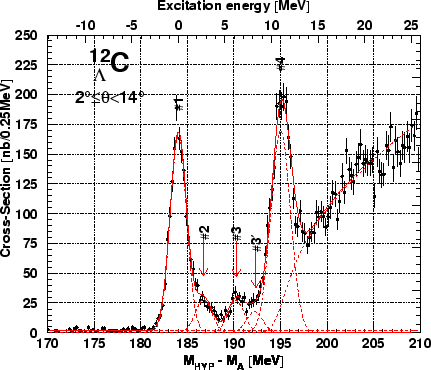
�$B?^�(B 3:
Excitation energy spectrum of  C measured with the SKS
spectrometer of KEK-PS by the
reaction.
C measured with the SKS
spectrometer of KEK-PS by the
reaction.
 |
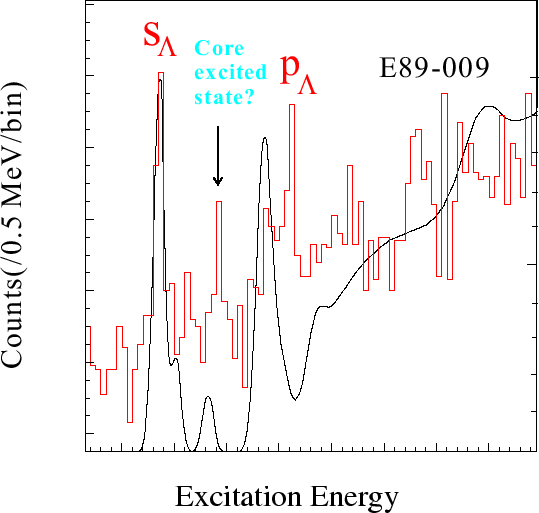
�$B?^�(B 4:
Excitation energy spectrum measured in the E89-009 experiment.
Solid line shows the result of Motoba's calculation.
 |
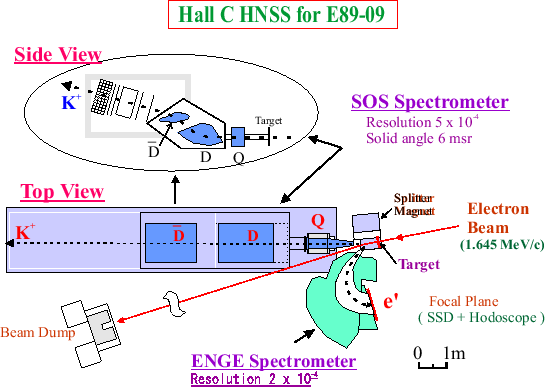
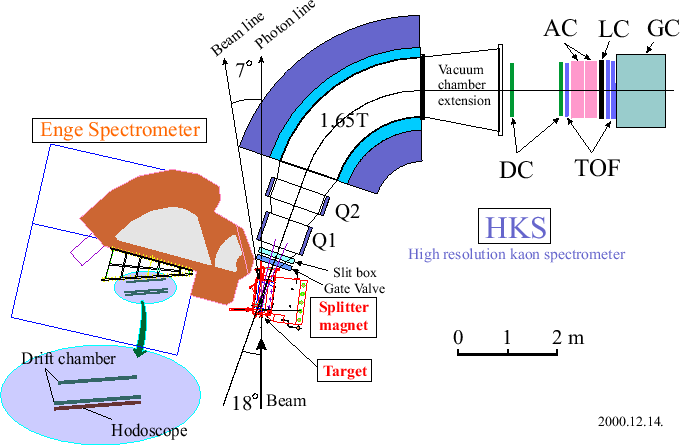
�$B?^�(B 5:
A schematic view of the E89-009 setup.
 |
�$B?^�(B 6:
Angular distribution of virtual photons with the  C target
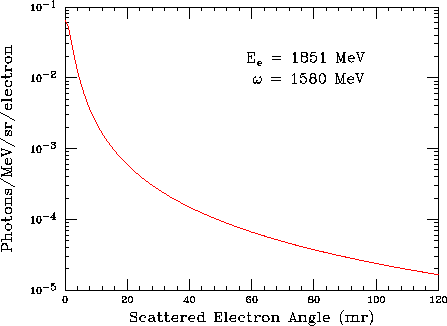 |
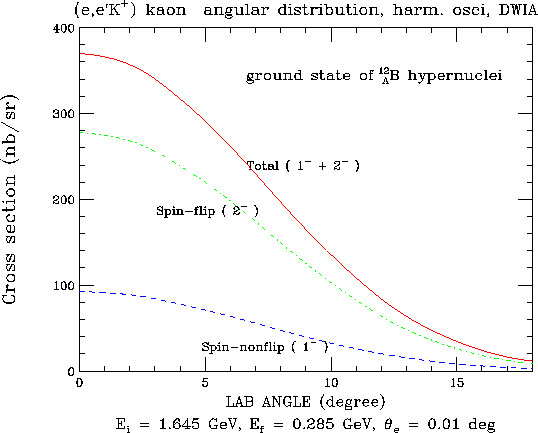
�$B?^�(B 7:
Angular distribution of kaon in the C(e,e'K )
)
 B
reaction.
B
reaction.
 |
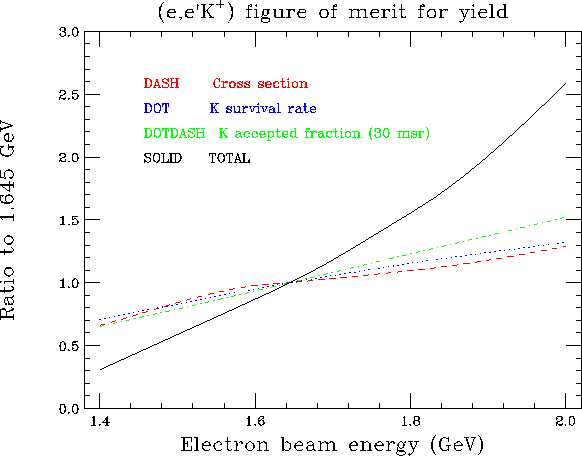
�$B?^�(B 8:
Hypernuclear yield of
B as a function of the beam energy
assuming scattered electrons are measured at E
as a function of the beam energy
assuming scattered electrons are measured at E = 0.285 GeV.
 |
�$B?^�(B 9:
Plan view of the high-resolution kaon spectrometer (HKS) and
Enge spectrometer for the proposed experiment.
 |
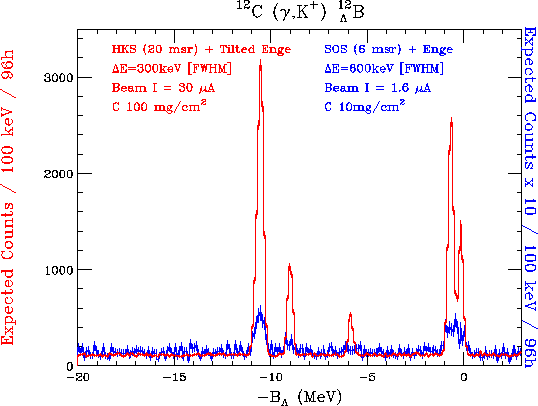
�$B?^�(B 10:
Simulated spectrum of the C(e,e'K)
B reaction
to be observed by the HKS in the proposed beam hours.
 |
�$B?^�(B 11:
Excitation energy spectrum of  Si measured with the SKS
spectrometer of KEK-PS by the
reaction.
Si measured with the SKS
spectrometer of KEK-PS by the
reaction.
 |
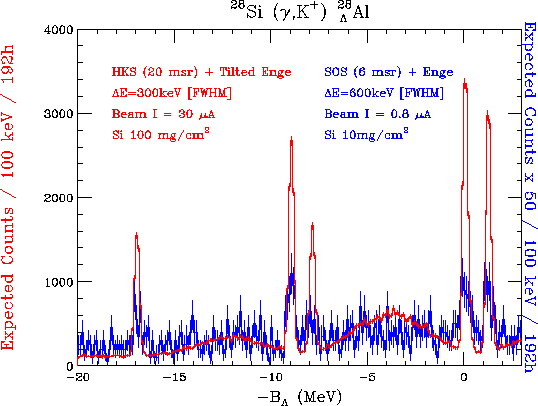
�$B?^�(B 12:
Simulated spectrum of the  Si(e,e'K)
 Al reaction
to be observed by the HKS in the proposed beam hours.
Al reaction
to be observed by the HKS in the proposed beam hours.
 |
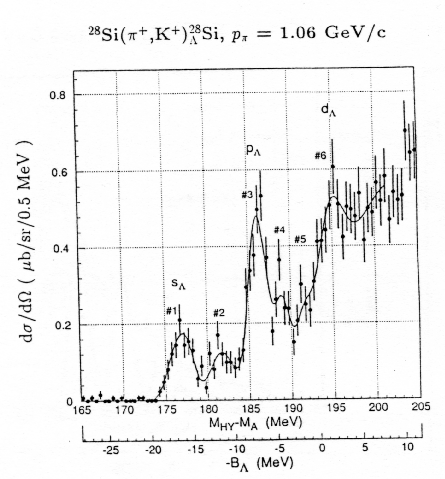
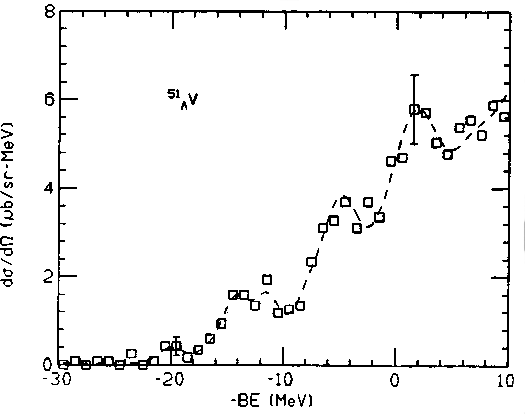
�$B?^�(B 13:
Excitation spectrum of
the  V(
V( ,K)
,K)
 V reaction
measured at BNL [1].
V reaction
measured at BNL [1].
 |
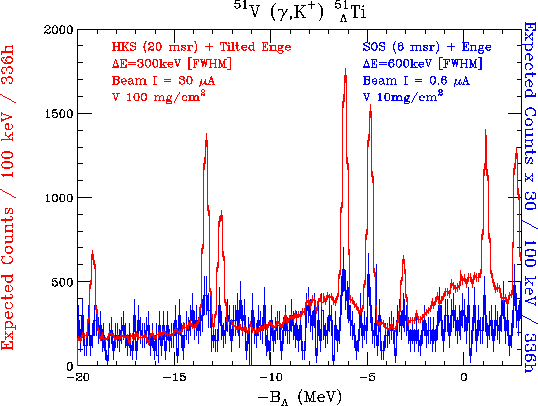
�$B?^�(B 14:
Simulated spectrum of the V(e,e'K)
Ti reaction
to be observed by the HKS in the proposed beam hours.
 |
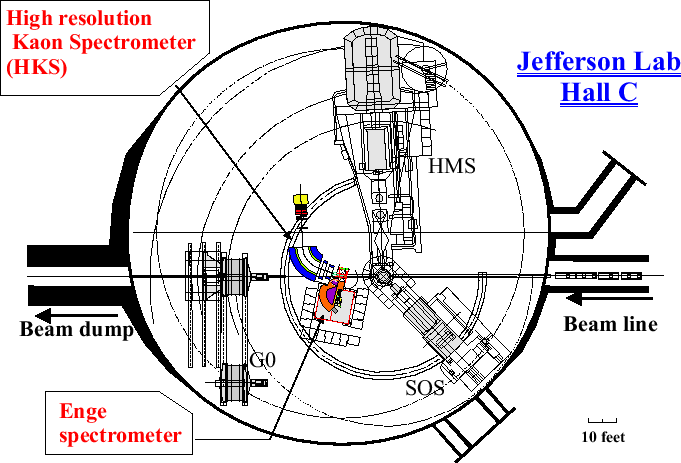
�$B?^�(B 15:
Expected Hall C setup of the HKS and Enge spectrometer.
The installation can be compatible with the G0 setup.
 |
�$B?^�(B 16:
Acceptance of the HKS spectrometer with the splitter installed.
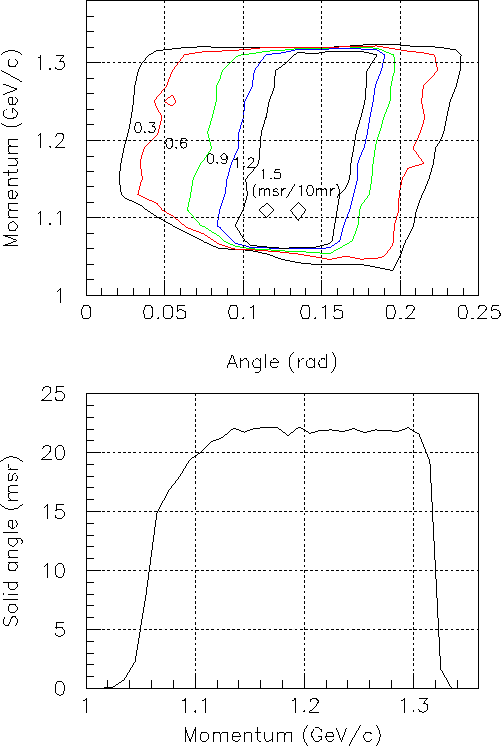 |
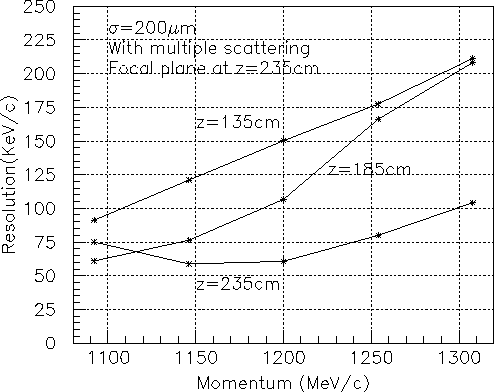
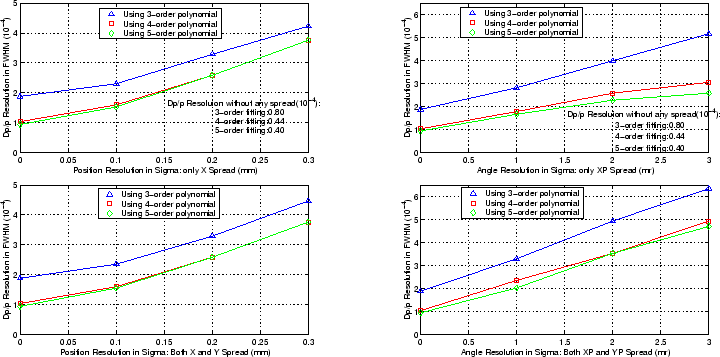
�$B?^�(B 17:
Resolution of the HKS spectrometer.
 |
�$B?^�(B 18:
Energy resolution of the Enge spectrometer for electrons.
 |
: �$B$3$NJ8=q$K$D$$$F�(B...
: proposal4-1
: �$B;29MJ88%�(B
Satoshi N. Nakamura
�$BJ?@.�(B16�$BG/�(B12�$B7n�(B2�$BF|�(B