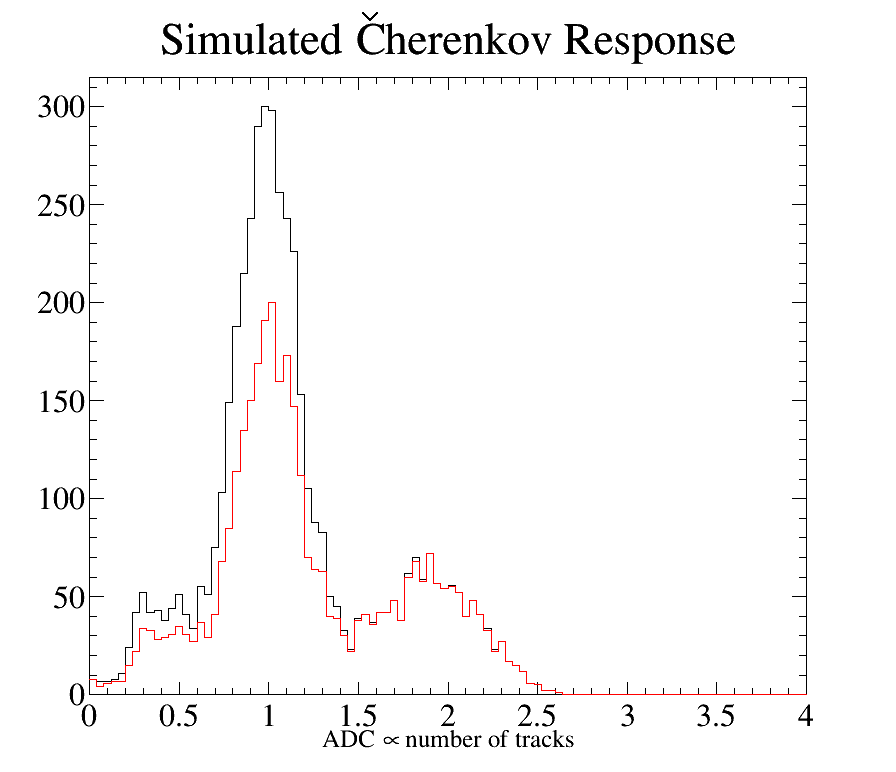
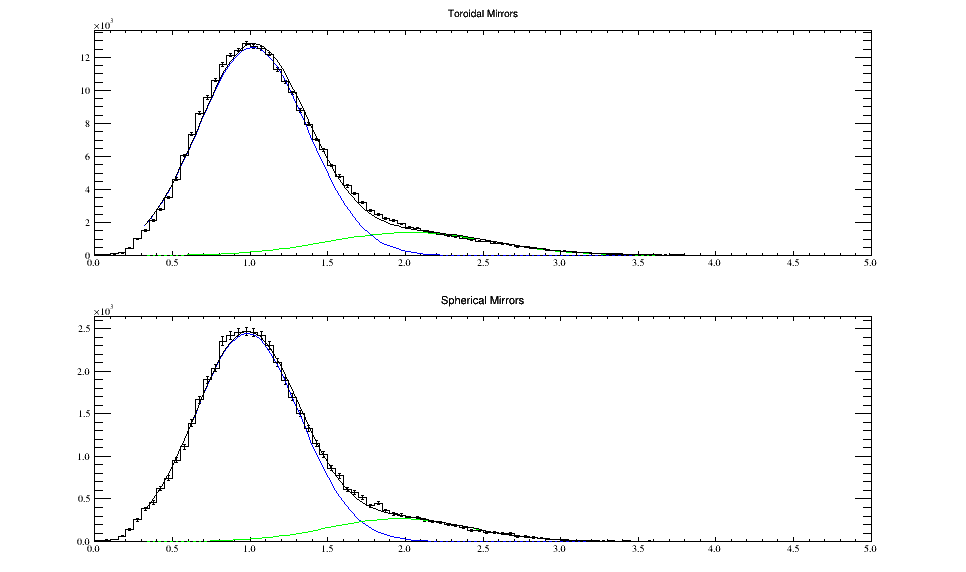
Here is Cherenkov spectrum showing the single and double tracks. The black line is for all events and the red line is only for pion events.
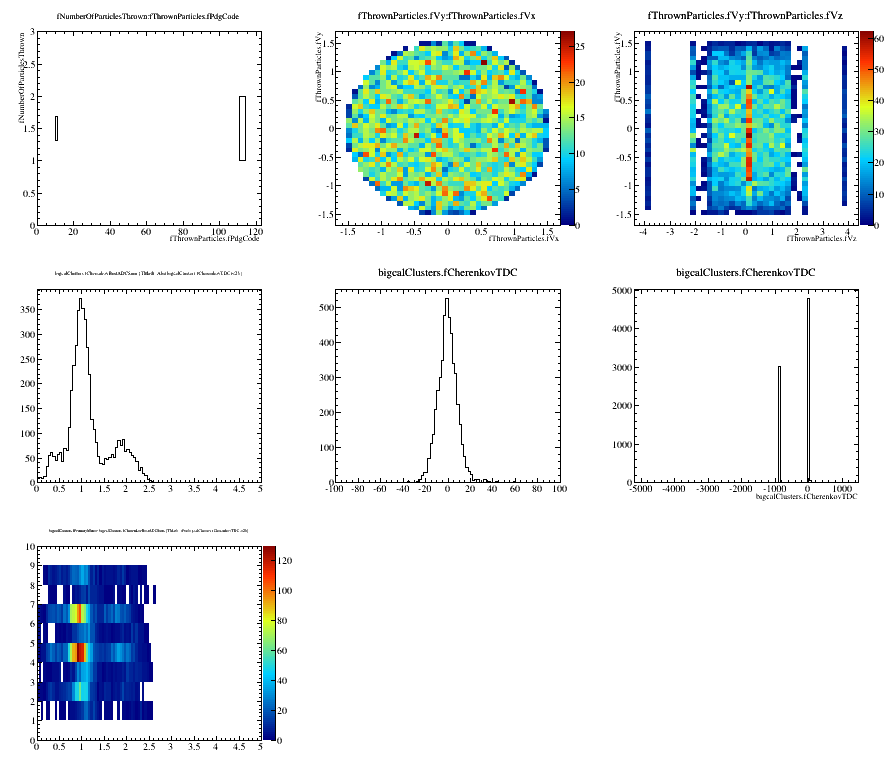
Simulations of the pion cross section (Oscar's fit) and DIS electrons (F1F209). Some details can be seen here. Also this file is the terminal output from the simulation and has some interesting information at the top about the various cross sections and material inputs. Note that more statistics are coming.
Here is Cherenkov spectrum showing the single and double tracks.
The black line is for all events and the red line is only for pion events.
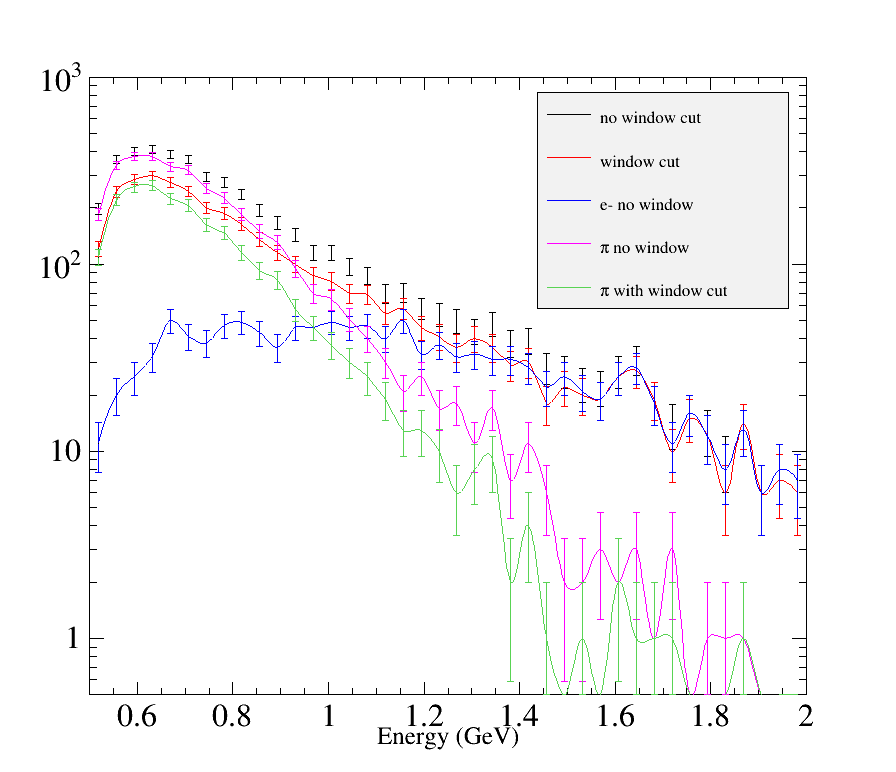
This plot shows the energy distribution of events. Note that the window cut consistently reduces the pion events.
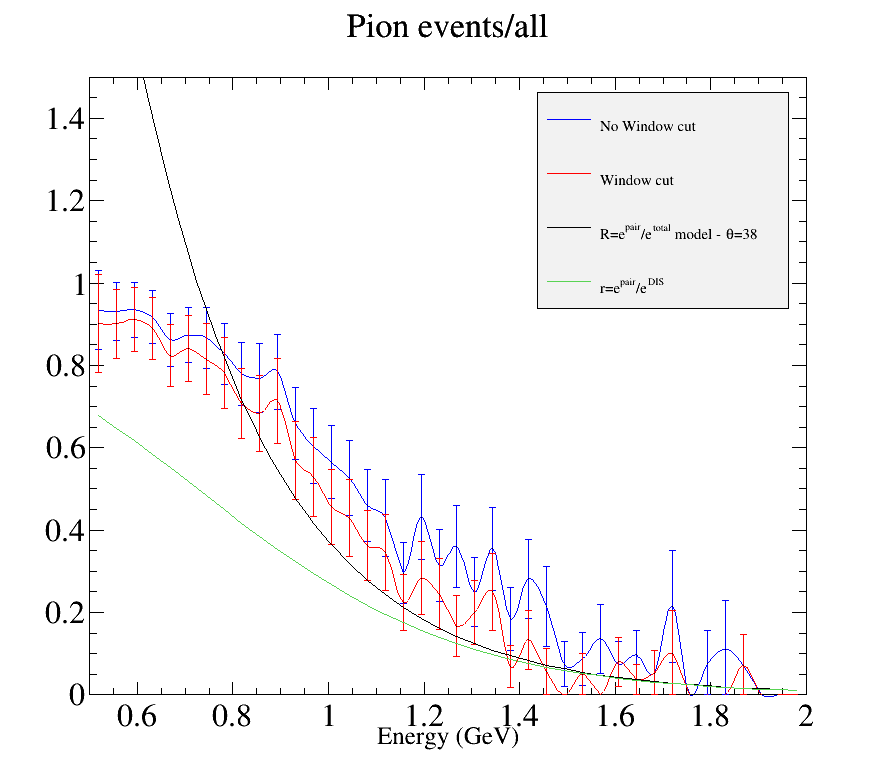
This plot shows the positron to electron ratio. Note that the window cut consistently reduces the pion events.
The black line is the model I have been using for my analysis and the green line is a calculation assuming the model is for the ratio (pairs/DIS) instead of (pairs/all).
Here is the typical track normalized ADC spectrum from the Cherenkov.
In order to select only pairs produced in the tracker a cut was placed from 2.0 up to 3.5.
The asymmetries from these events is shown below. The lower E' cut was at 800 MeV.
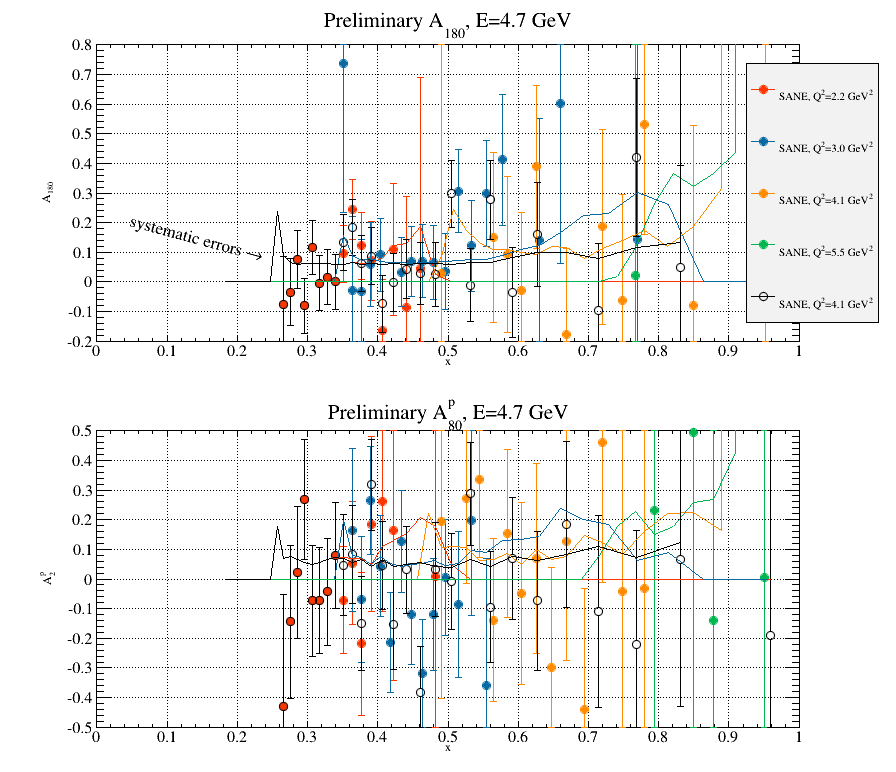
Asymmetries for 4.7 GeV
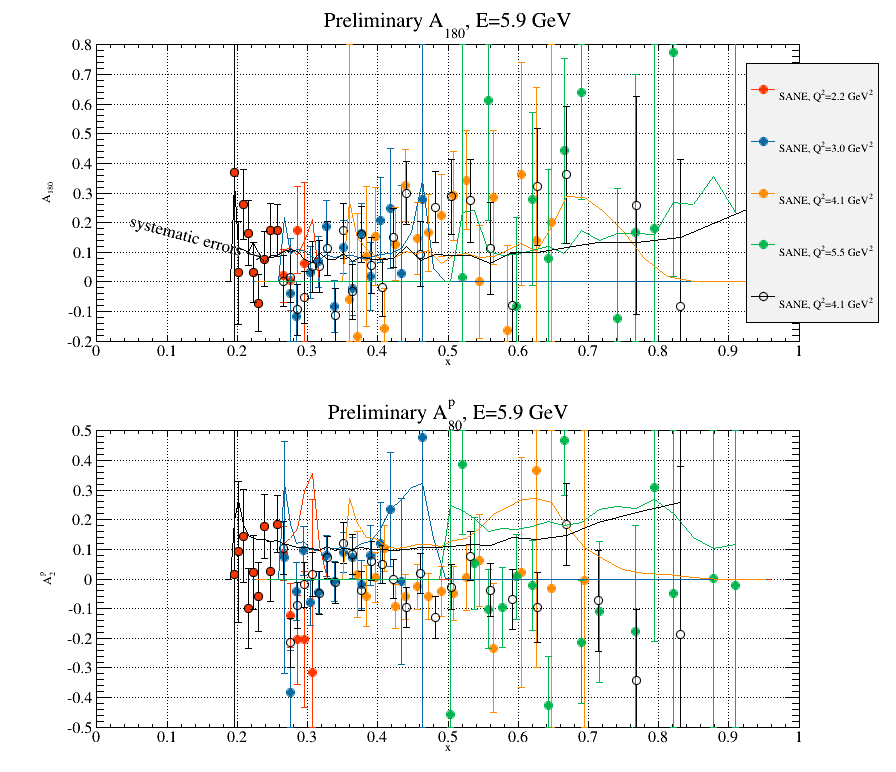
Asymmetries for 5.9 GeV
| Name | Last modified | Size | Description | |
|---|---|---|---|---|
| Parent Directory | - | |||
| Cherenkov8.png | 2015-01-09 17:56 | 14K | ||
| simulated_cherenkov2..> | 2015-01-09 17:56 | 17K | ||
| simulated_cherenkov4..> | 2015-01-09 17:56 | 22K | ||
| simulated_cherenkov3..> | 2015-01-09 17:56 | 25K | ||
| simulated_cherenkov_..> | 2015-01-09 17:56 | 37K | ||
| A1_combined_split_40..> | 2015-01-09 17:56 | 60K | ||
| A180A80_47_408.png | 2015-01-09 17:56 | 60K | ||
| x2g1g2_combined2_408..> | 2015-01-09 17:56 | 64K | ||
| A180A80_59_408.png | 2015-01-09 17:56 | 67K | ||
| betag4_example.out | 2015-01-09 17:56 | 194K | ||