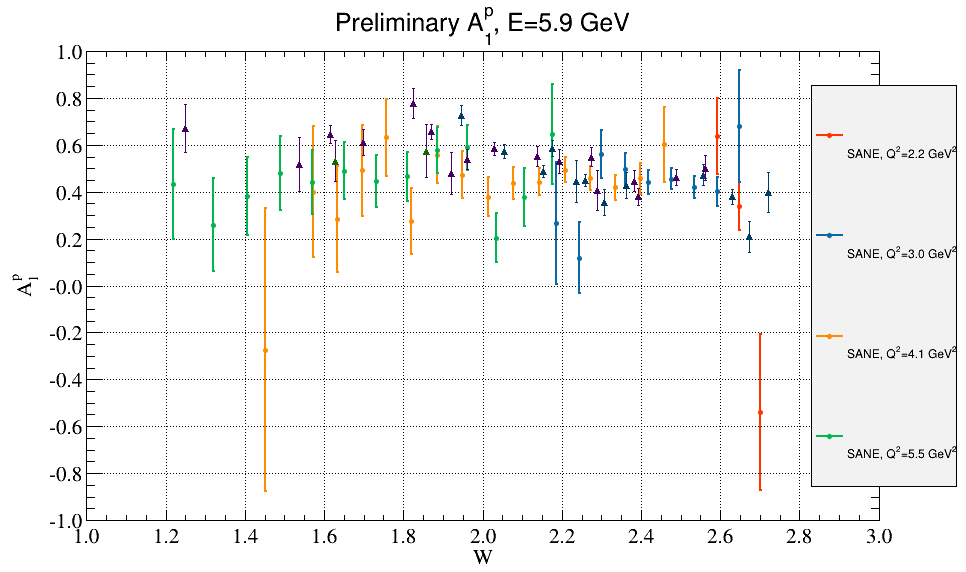
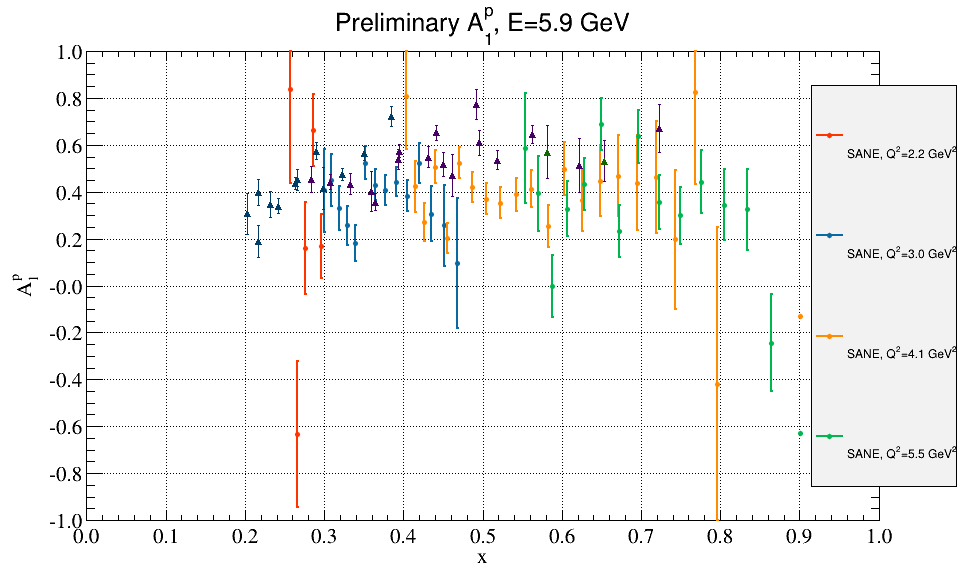
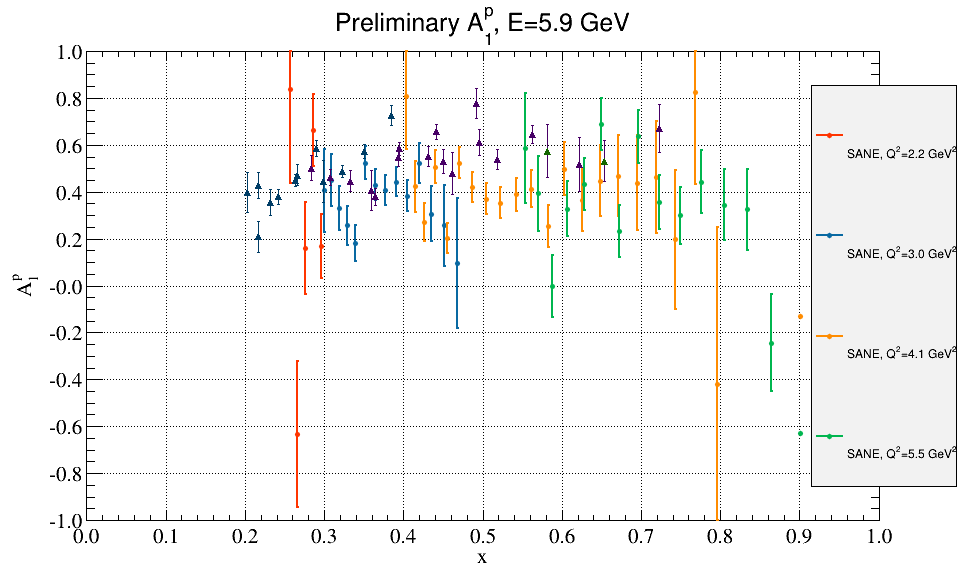
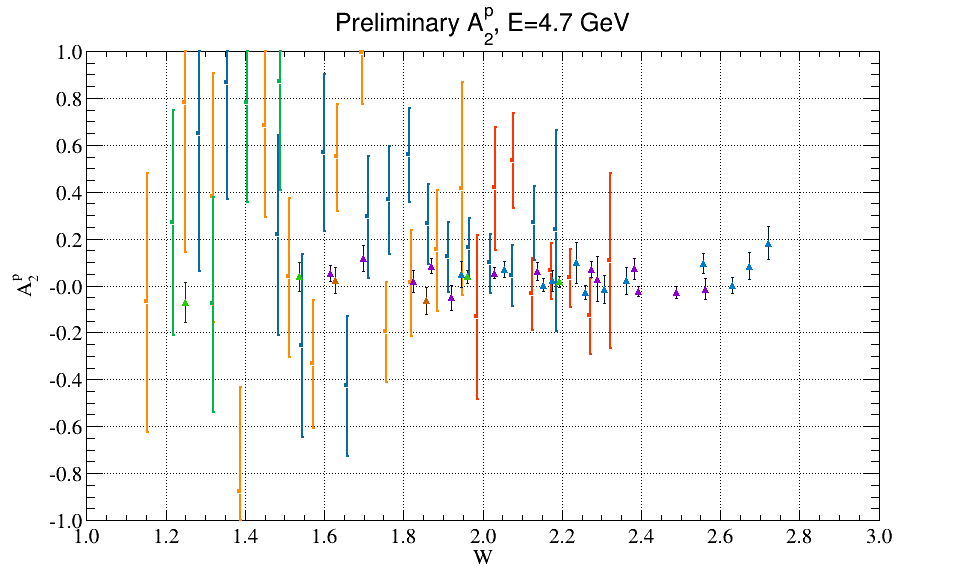
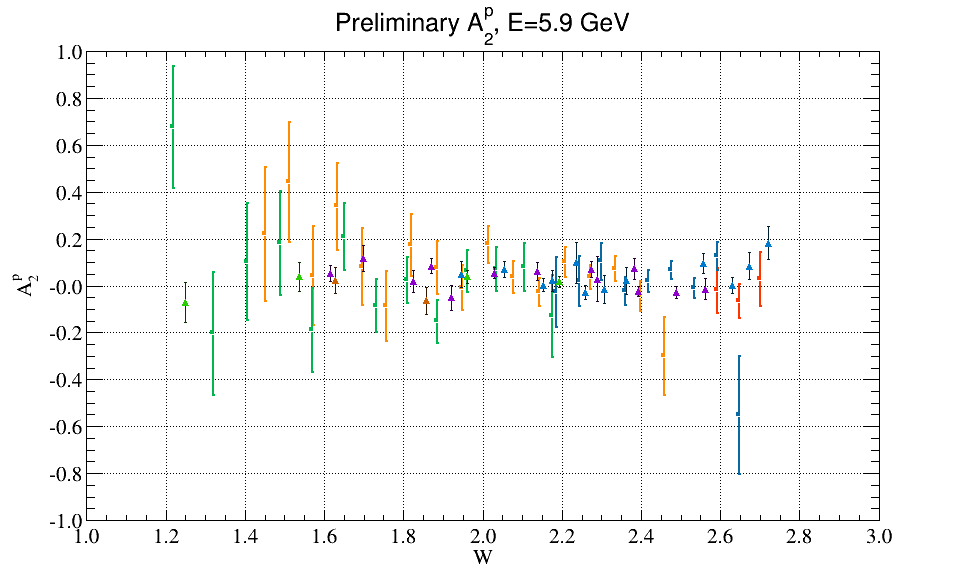
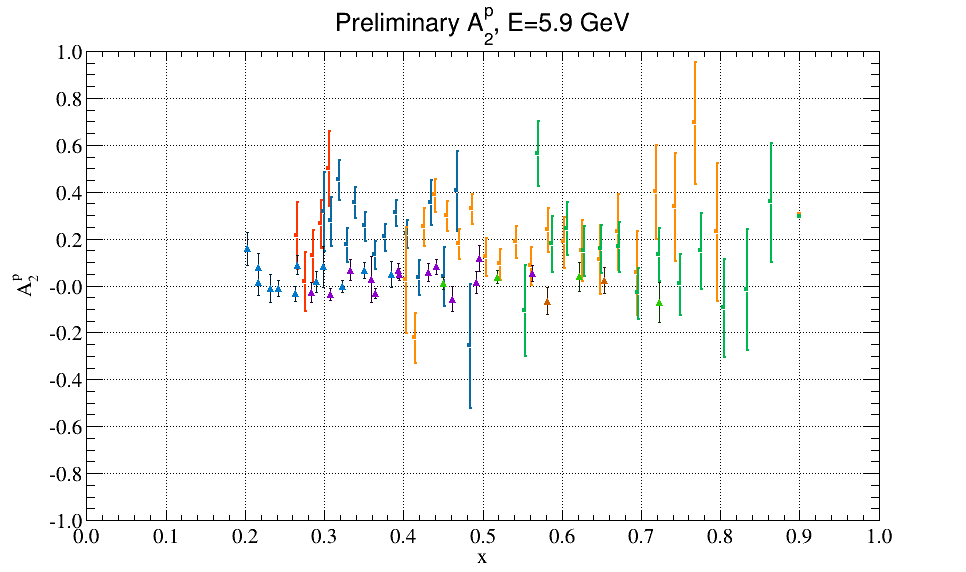
The cuts in the following graphs include Energy greater than 1.3 GeV, Cherenkov TDC, Cherenkov ADC, tigger type, and noisy/bad block removal.
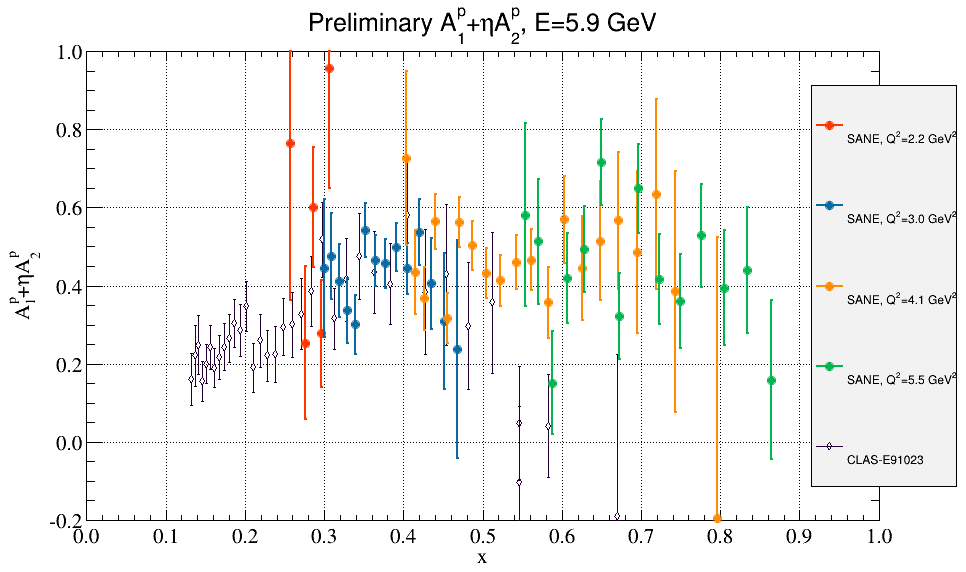
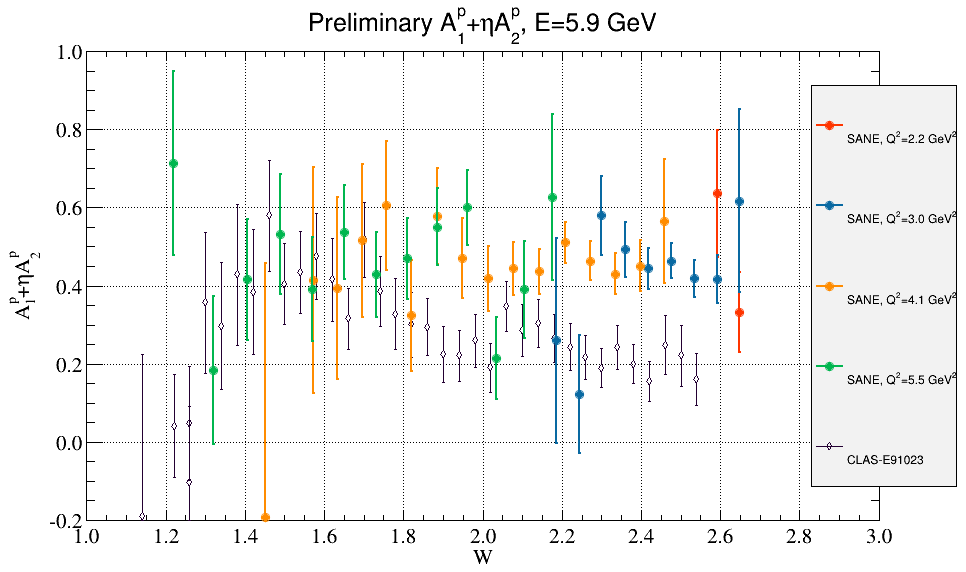
The plots numbered 644 are with the UVa 1/13 data, and 64 with their previous. When comparing the two, A1 and A2 both increased.
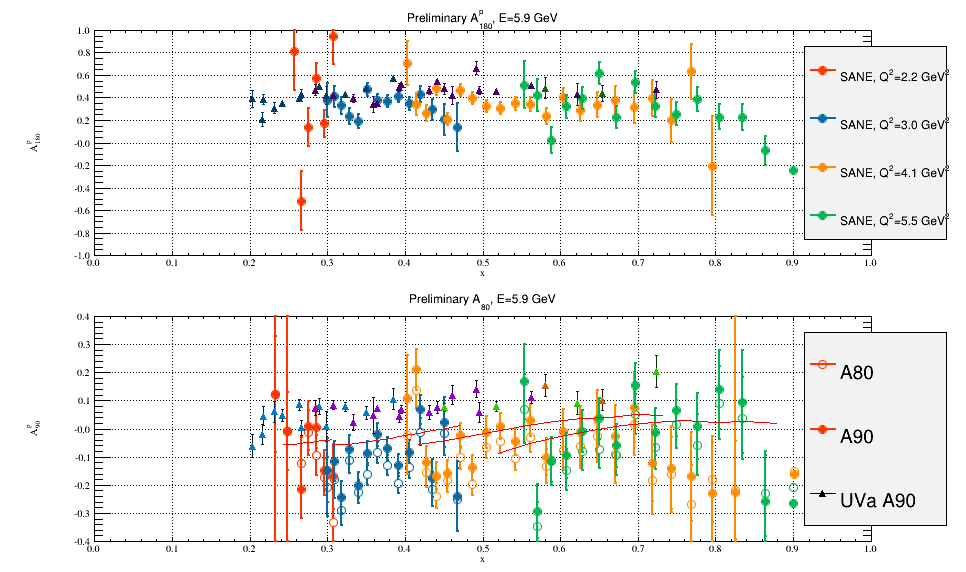
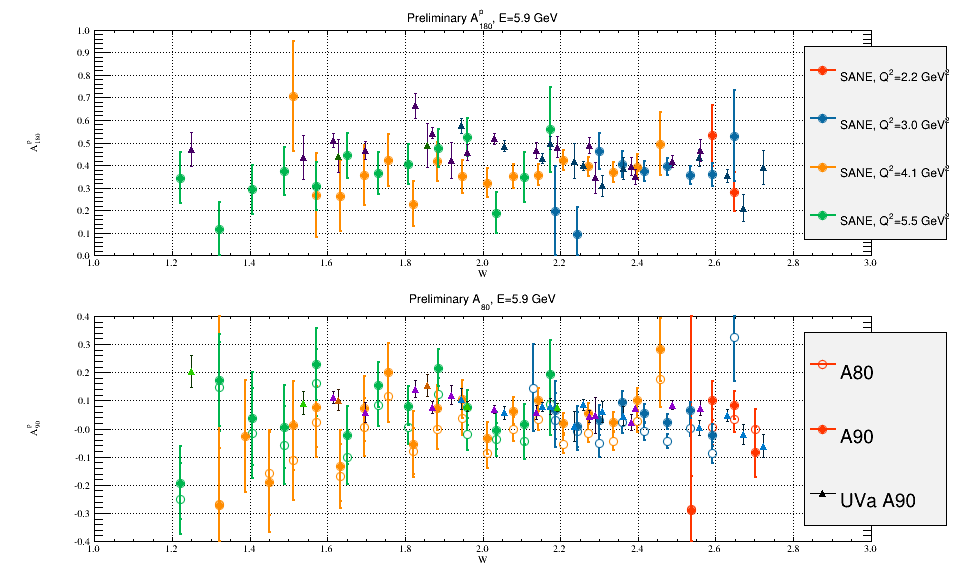
The plots of A90 compare my results with Hovannes's. Unlike Hovannes, I am calculating A90 from A80 and A180. On the plot Vs x, I calculated for theta=40 and the central Q2 values the asymmetry A80 (which are shown as the red lines).
The plots compare_AparaOverD_59_64.png and compare_AparaOverD_59_W_64.png shows A1/D against some CLAS data where their Q2 was from 0.8 to 1.1 GeV^2. There is only a very slight overlap in kinematics. I couldn't find any other published data from CLAS. Also their database is down...
| Name | Last modified | Size | Description | |
|---|---|---|---|---|
| Parent Directory | - | |||
| A2_noel_644.png | 2015-01-09 17:56 | 19K | ||
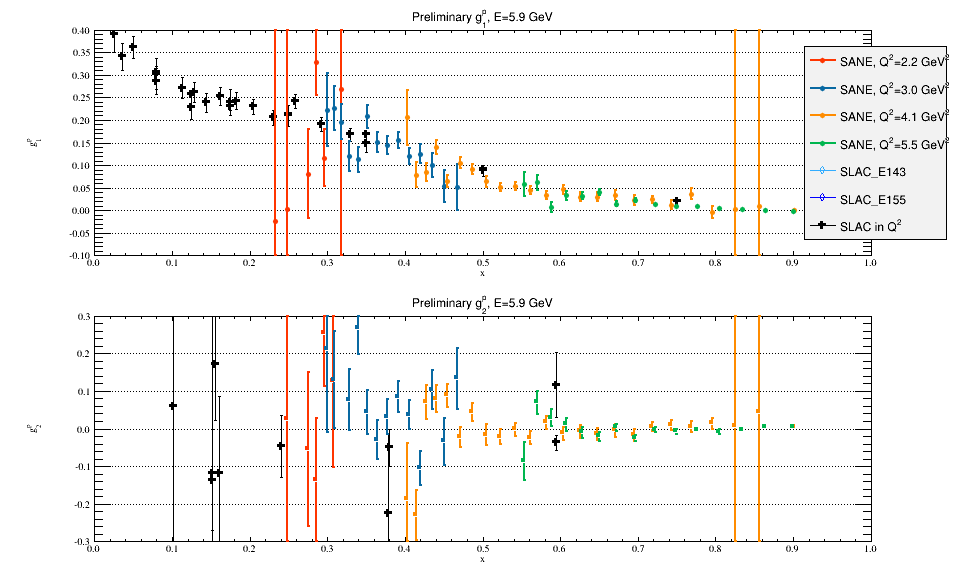
| g1g2_59_64.png | 2015-01-09 17:56 | 24K | ||
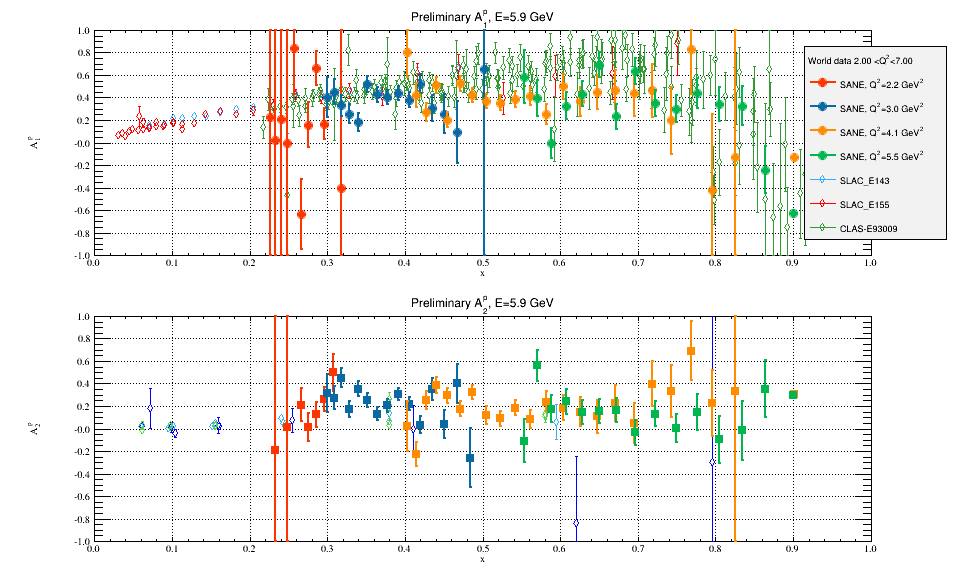
| A1A2_59_W_noel_64.png | 2015-01-09 17:56 | 32K | ||
| A1A2_59_noel_64.png | 2015-01-09 17:56 | 41K | ||
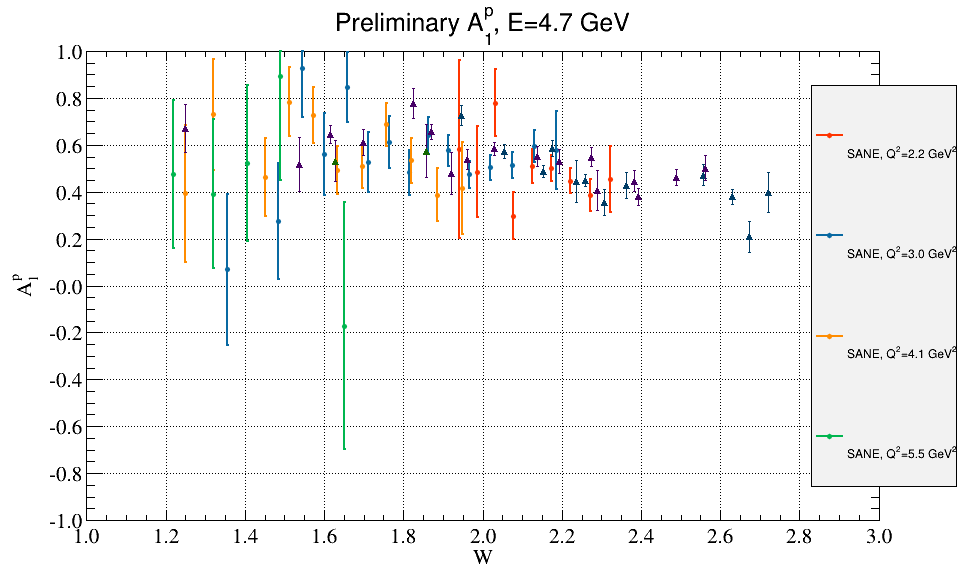
| A1_47_W_noel_644.png | 2015-01-09 17:56 | 25K | ||
| A1_W_noel_644.png | 2015-01-09 17:56 | 26K | ||
| A1_noel_64.png | 2015-01-09 17:56 | 27K | ||
| A1_noel_644.png | 2015-01-09 17:56 | 27K | ||
| A2_47_W_noel_644.png | 2015-01-09 17:56 | 19K | ||
| A2_W_noel_644.png | 2015-01-09 17:56 | 19K | ||
| A2_noel_64.png | 2015-01-09 17:56 | 19K | ||
| A90_59_644.png | 2015-01-09 17:56 | 50K | ||
| A90_59_W_644.png | 2015-01-09 17:56 | 45K | ||
| compare_AparaOverD_5..> | 2015-01-09 17:56 | 32K | ||
| compare_AparaOverD_5..> | 2015-01-09 17:56 | 30K | ||
| x2g1g2_59_64.png | 2015-01-09 17:56 | 27K | ||
| x2g1g2_59_d2_64.png | 2015-01-09 17:56 | 14K | ||
| xg1g2_59_64.png | 2015-01-09 17:56 | 26K | ||