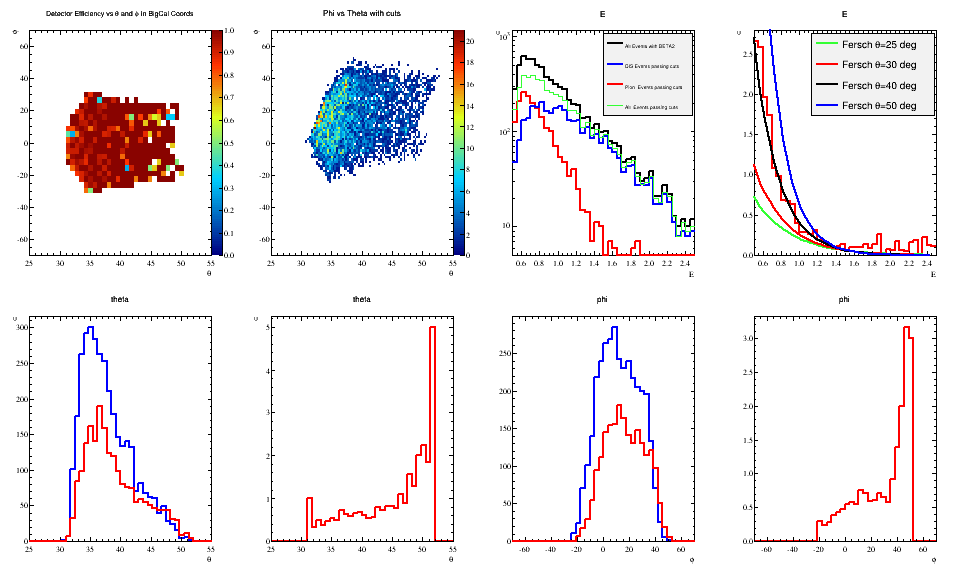
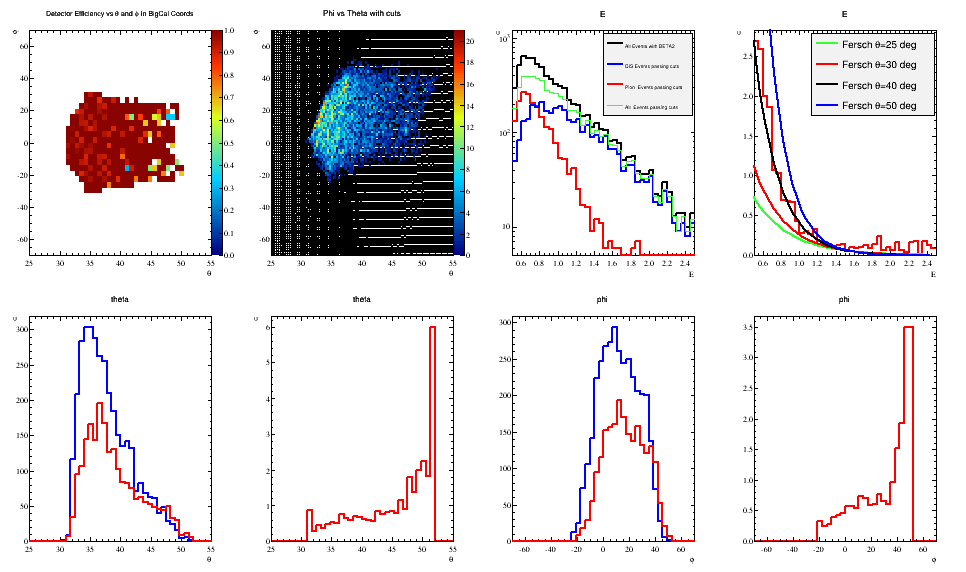
The GEANT4 simulation was run throwing DIS electrons and pi0s (electro and photoproduction) from all target materials. With typical electron cuts the following graphs are produced:
What does this tell us?
The simulation agrees well with a previous experiment and can be trusted.
What about the data?
Since I know exactly the cross sections thrown, the "simulated charge" (or if beam current is assumed, "simulated time") can be calculated from the number of events.
Therefore we can compare the normalized rates of data to MC.
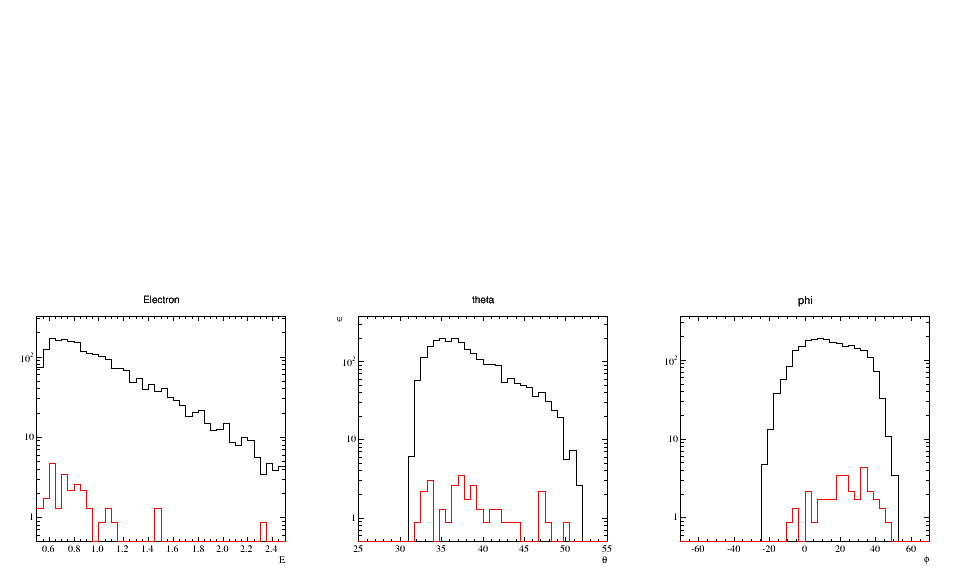
The plot above is from the MC results. The plots are:
Black: The normalized rate for "electrons" passing the electron cuts.
Red: The normalized rate for 2 cluster - no cherenkov events (possibly pi0s).
Ignoring the first row, the plots below are from data
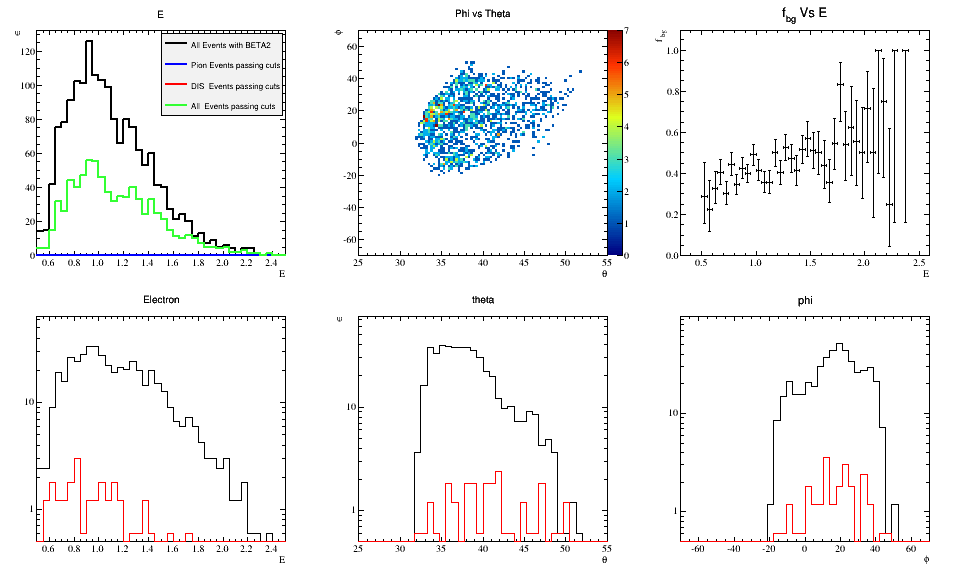
The distributions of events looks pretty reasonable. The trigger inefficiency is expected and at higher energy the agreement becomes better.
| Name | Last modified | Size | Description | |
|---|---|---|---|---|
| Parent Directory | - | |||
| thrown_particle_dist..> | 2015-01-09 17:56 | 32K | ||
| f_pairs_para59_rates..> | 2015-01-09 17:56 | 8.1K | ||
| f_pairs_para59_data_..> | 2015-01-09 17:56 | 22K | ||
| f_pairs_para59_20.png | 2015-01-09 17:56 | 32K | ||
| f_pairs_para59_20.pdf | 2015-01-09 17:56 | 44K | ||
| f_pairs_para59_19.png | 2015-01-09 17:56 | 34K | ||