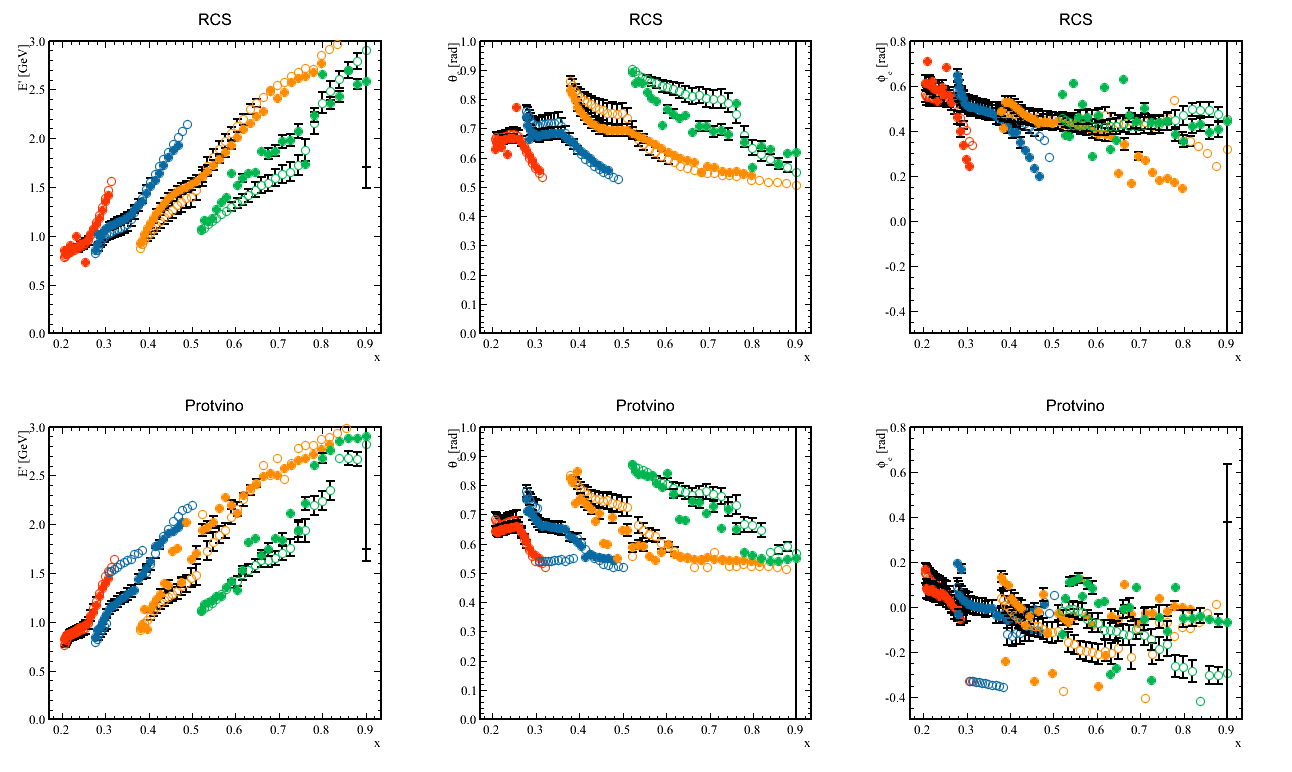
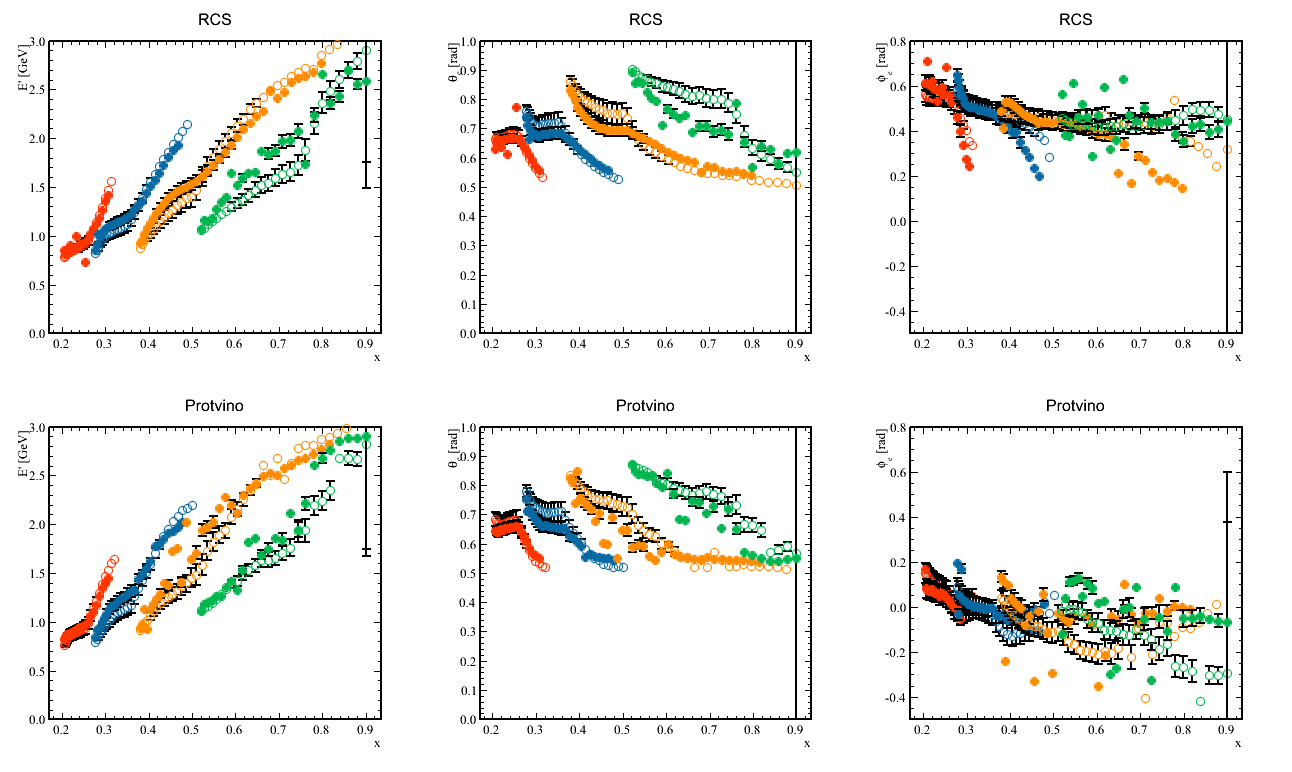
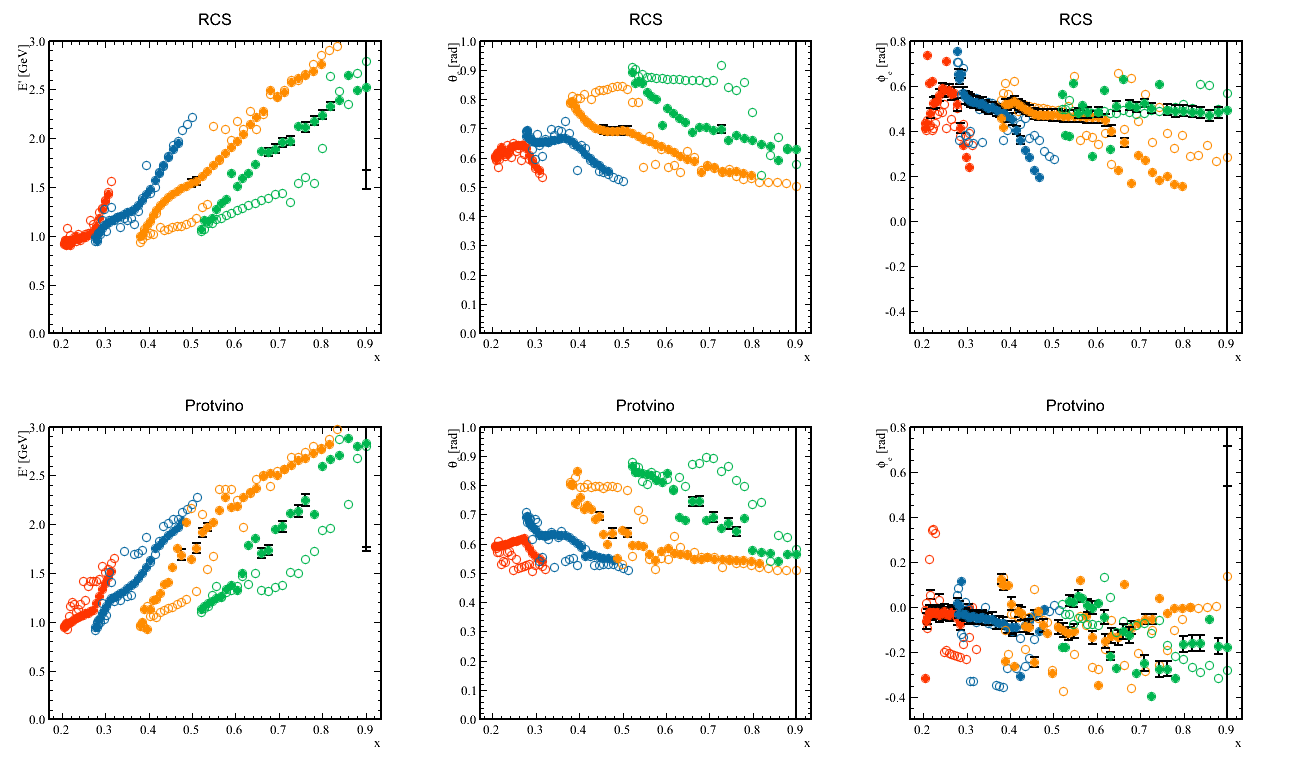
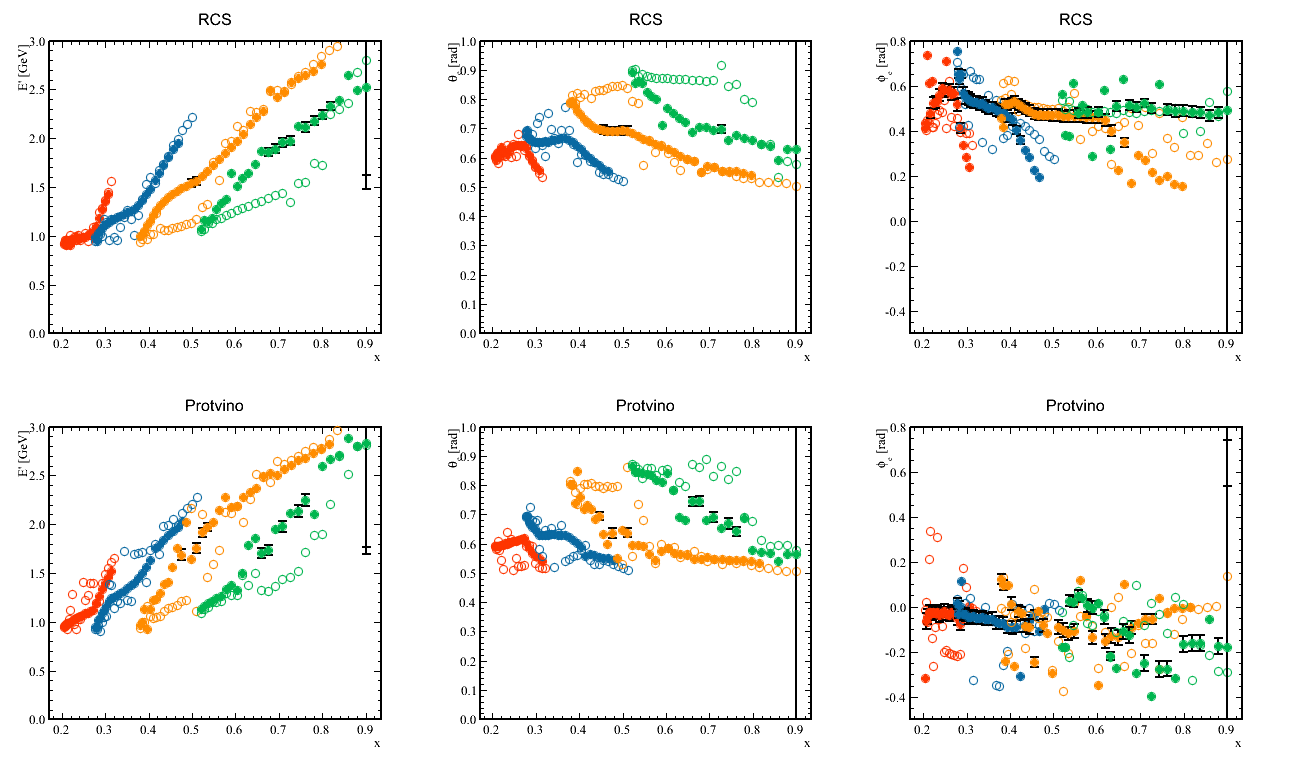
The top plots are RCS and the bottom are Protvino vs x.
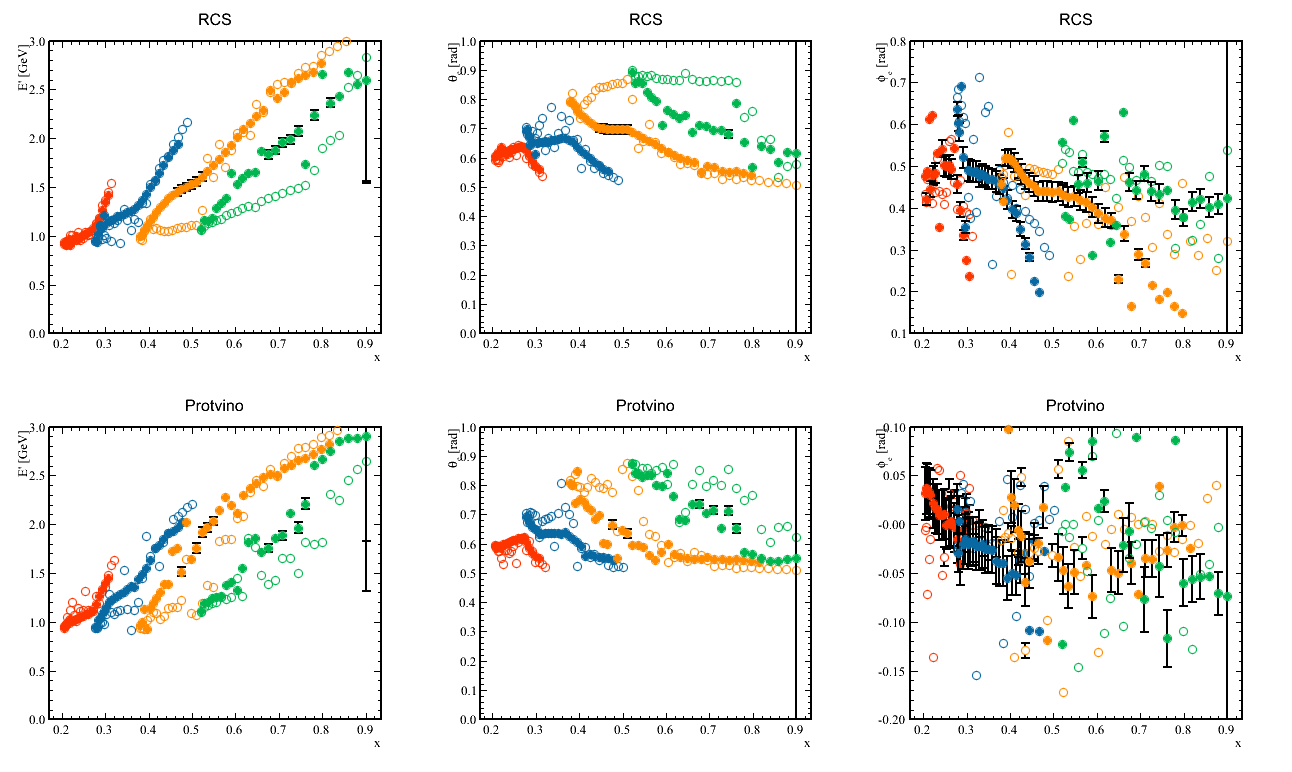
There is clearly a difference between the two sections.
| Name | Last modified | Size | Description | |
|---|---|---|---|---|
| Parent Directory | - | |||
| asym_kine_59_4.png | 2015-01-09 17:56 | 142K | ||
| asym_kine_59_2.png | 2015-01-09 17:56 | 139K | ||
| asym_kine_59_3.png | 2015-01-09 17:56 | 138K | ||
| asym_kine_59_0.png | 2015-01-09 17:56 | 138K | ||
| asym_kine_59_1.png | 2015-01-09 17:56 | 137K | ||
| compare_A1A2_59_216.png | 2015-01-09 17:56 | 78K | ||
| compare_A1A2_59_116.png | 2015-01-09 17:56 | 77K | ||
| compare_A1A2_phi2_59..> | 2015-01-09 17:56 | 58K | ||
| compare_A1A2_phi2_59..> | 2015-01-09 17:56 | 50K | ||
| polXsecCompare.png | 2015-01-09 17:56 | 30K | ||
| polXsecCompare.pdf | 2015-01-09 17:56 | 17K | ||