User name ent
Log entry time 16:13:39 on February 27,2000
Entry number 21735
keyword=SOS findingsChecked various things in SOS, here a summary:
- ssbeta vs. ssshtrk (as example) shows some discrete images.
This may mean that we have a bit problem in one of the TDC's
again. Maybe S1x+ or so? I will add the plot later in this entry.
Maybe Steve and Dave can check this too.
- SCAL A4+ has a problem, and SCAL B- is missing. Did not
check whether the latter is just a HV-off problem. As we likely
need the various shower counter signals in the trigger to cut
down e+ rate, I would like the Yerevan people (Hamlet, Vardan)
to look at this.
- The Wire chambers look fine, only obvious (software) problem
is that the drift times should all be shifted by about 15 ns. That
should fix the drift distances. Hope Lulin can do this.
- The real thing I don't understand is likely physics-related:
- Why do I see more "peaks" in delta with sieve slit than
without?
- Why does a run with large collimator have a delta peak
at -25% and a broad peak between -5 and -10% only?
- Why are there almost only positrons, and why are they
confined in delta space?
- Why are all the positrons in only small xptar-yptar phase
space. This may just be caused by an intricate conspiracy
between e+/e- production and splitter/SOS optics, but I
could not find a way to convince myself, especially as
the delta spectrum looks different with a large collimator.
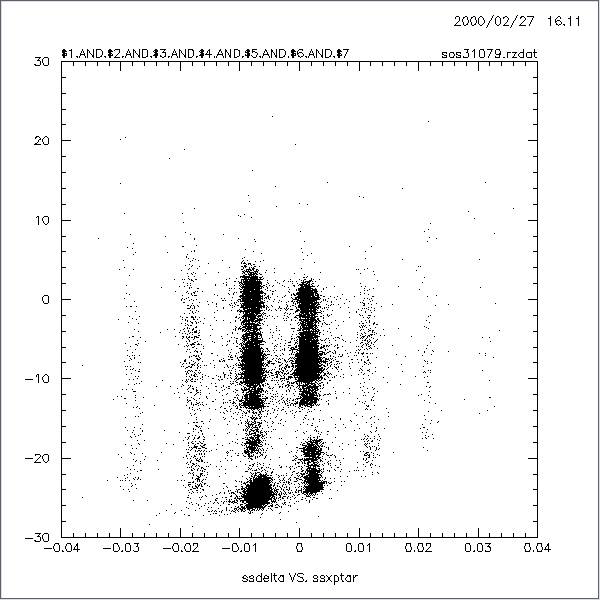
What is the good news: I think a good job was done with the SOS reconstruction
set, as the various spectra look proper. E.g., I see beautiful delta vs xptar stripes,
as they should be independent. Will add an example.
For reference sake, I checked that the delta spectra already appear in the
chambers themselves, so we don't have a funny software problem here,
it's real physics doing it.
I used runs 31170 and 31153 for the analysis.
Here some sample plots:
FIGURE 1

FIGURE 2
