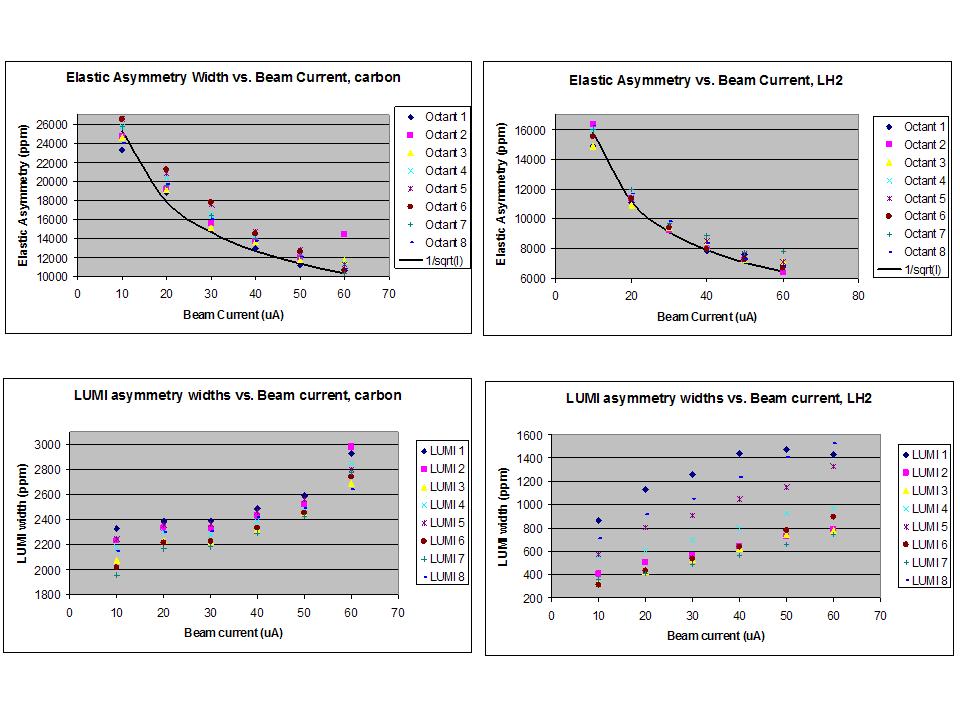
In the early part of the running period, there was a period of about a
day (covering approximately runs: 29959 - 30040) where there were several
odd things observed even though the normalized halo rates were very
reasonable.

An incomplete list of the odd effects observed during that period include:

a)  Luminosity monitor widths much larger than normal and not behaving
as they should versus beam current for the carbon or hydrogen targets.
See log entry:
118974

b) Muti-hit scaler rates that behaved in a strange way; see log entry

119481
(This is analysis of a data that was taken during the period of interest).

c) Strange behavior of the Cerenkov rates versus beam current for
carbon and hydrogen targets.  See log entry:

119320


I decided to look at whether the elastic asymmetry widths appeared to
be behaving normally during this period (see Figure 1).  As shown in the
top two plots, the elastic asymmetry widths for both the carbon (left)
and hydrogen (right) target decrease following the 1/sqrt(I) behavior, as
expected. In general, the elastic widths for this running period were no
greater than the later running with good lumi widths.  The lumi widths
for carbon (bottom left) and hydrogen (bottom right) are shown for
reference.
Figure 1 - Elastic asymmetry and lumi widths for "bad" lumi runs 29959-29972.