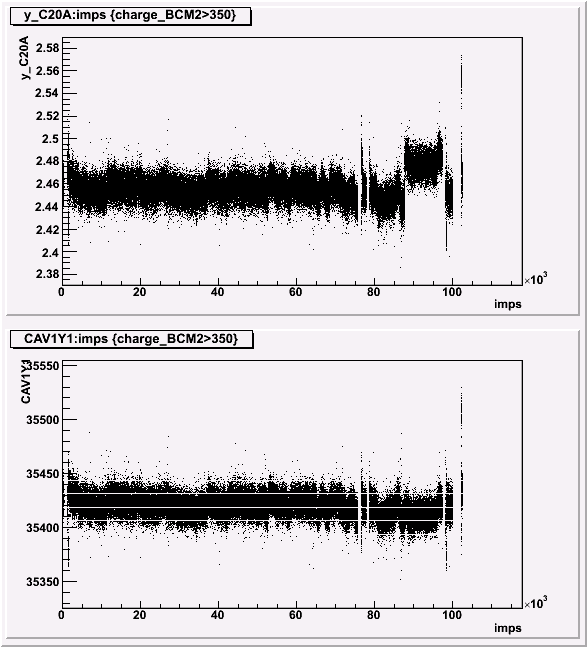
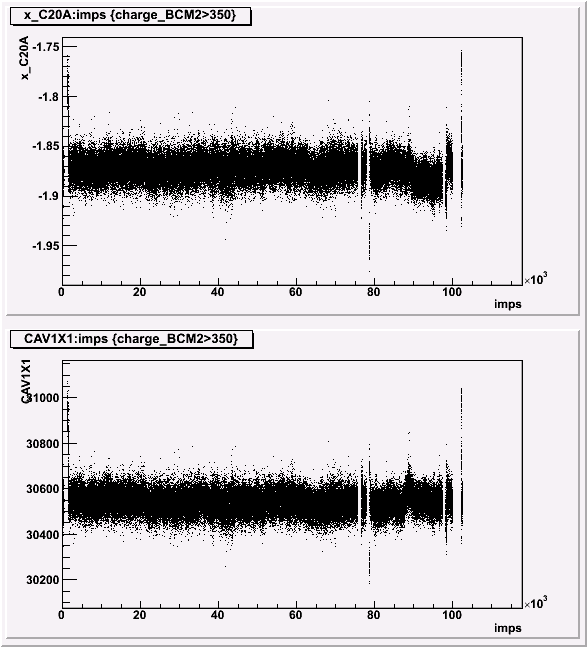
When I plot the cavity and BPM signals vs imps, (Figures 1 and 3) it appears that for a certain imps period, ~90e3 to 98e3, the BPM signal is changing by more than the cavity monitor signal changes. It is more pronounced in the y signals.
In Figures 2 and 4 I show the cavity vs. BPM signal for the x and y values with and without cuts to cut out the period where the BPM seems to be responding differently than the cavity monitor. It seems that this really is the cause of the second distribution. I am not sure what this means as far as the cavity signal goes.
But this double distribution has occured in more runs than this one.
A copy of this log entry has been emailed to: suleiman@jlab.org, jschaub@jlab.org, pitt@vt.edu
Figure 1 - Cavity and BPM y signals vs. imps.

Figure 2 - Cavity vs BPM y signals with and without imps cuts.

Figure 3 - Cavity and BPM x signals vs. imps.

Figure 4 - Cavity vs BPM x signals with and without imps cuts
