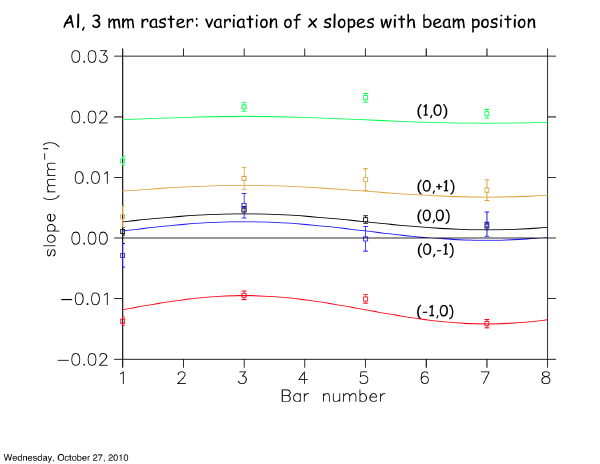
The attached figures show the variation of asymmetry due to position modulation with position
of beam and bar number for runs 6090 - 6094. The asymmetries are derived from inherent
motion of the beam, with the usual proviso that other modulations may have been present as
well. The target was 4% US Al, 3x3 raster, 5 uA of beam. The sensitivities are from Nur's
analysis:

https://hallcweb.jlab.org/hclog/1010_archive/101025144318.html

Figure 1 shows sensitivity to motion of the beam in the vertical direction. The position (x,y) of
the beam is shown for each curve. The solid lines are sine(phi) fits, which is what is expected
for motion in y, so bars 3 and 7 have the greatest sensitivity.  The sensitivity doesn't change
significantly between x = -1 and x = +1 mm at y=0. The expected maximum sensitivity at y=0
is ~0.02 per mm of modulation, greater than observed. The average asymmetry of bars 3 and 7
for y=0 is ~0, consistent with a neutral axis near y=0. There is greater than expected variation
with the vertical position of the beam.

Figure 2 shows the sensitivity to motion in x. The lines are mostly to guide the eye, as the
curves do not follow the expected cos(phi) form. Bars 1 and 5 should show the greatest
sensitivity to motion in x. There is large sensitivity to horizontal position of the beam, less for
vertical. The distributions are fairly flat. Another beam modulation may be masking the effects
of position modulation.

Measurement of sensitivities with a very small raster and for forced modulation would be
interesting!
Figure 1
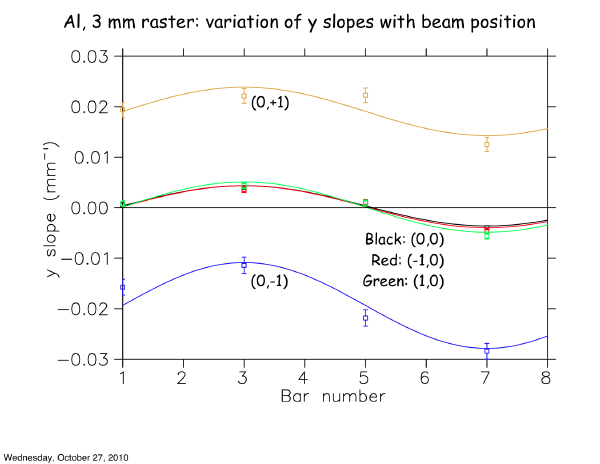
Figure 2