Main INDEX,
Monthly INDEX,
PREV,
NEXT
Make New Entry,
Make Followup Entry (Advanced)
User name qwanalysis
Log entry time 16:30:24 on January 29, 2012
Entry number 250803
keyword=Analysis: Run 15573 - Plots and Summary Table for 100k Events.
Automatic entry from the first 100k analysis
---------------------------------------------------------
|	Run Number:  15573				|
|  Qweak Target: HYDROGEN-CELL , 177.2 uA,   4.0x4.0 mm |
---------------------------------------------------------
|I                        	|uA    	|177.2 uA      	|
|MDALLBARS width          	|ppm   	|233.1        	|
|BCM78-ddif width         	|ppm   	|62.1        	|
|A_q mean                 	|ppm   	|-1.84        	|
|A_q width                	|ppm   	|405.2        	|
|MDALLBARS X-sens.        	|ppm/mm	|957.0+-180.6 	|
|MDALLBARS Y-sens.        	|ppm/mm	|2877.0+-192.5 	|
|BMOD MDALLBARS X-sens.   	|ppm/mm	|0.0+-0.0 	|
|BMOD MDALLBARS Y-sens.   	|ppm/mm	|-740.8+--397.2 	|
|BMOD MDALLBARS E-sens.   	|ppm/mm	|0.0+-0.0 	|
---------------------------------------------------------
This is logged by hclog_post and qwanalysis [hclog_post 1.1]
A copy of this log entry has been emailed to: qweak_autoanalysis@jlab.org
FIGURE 1
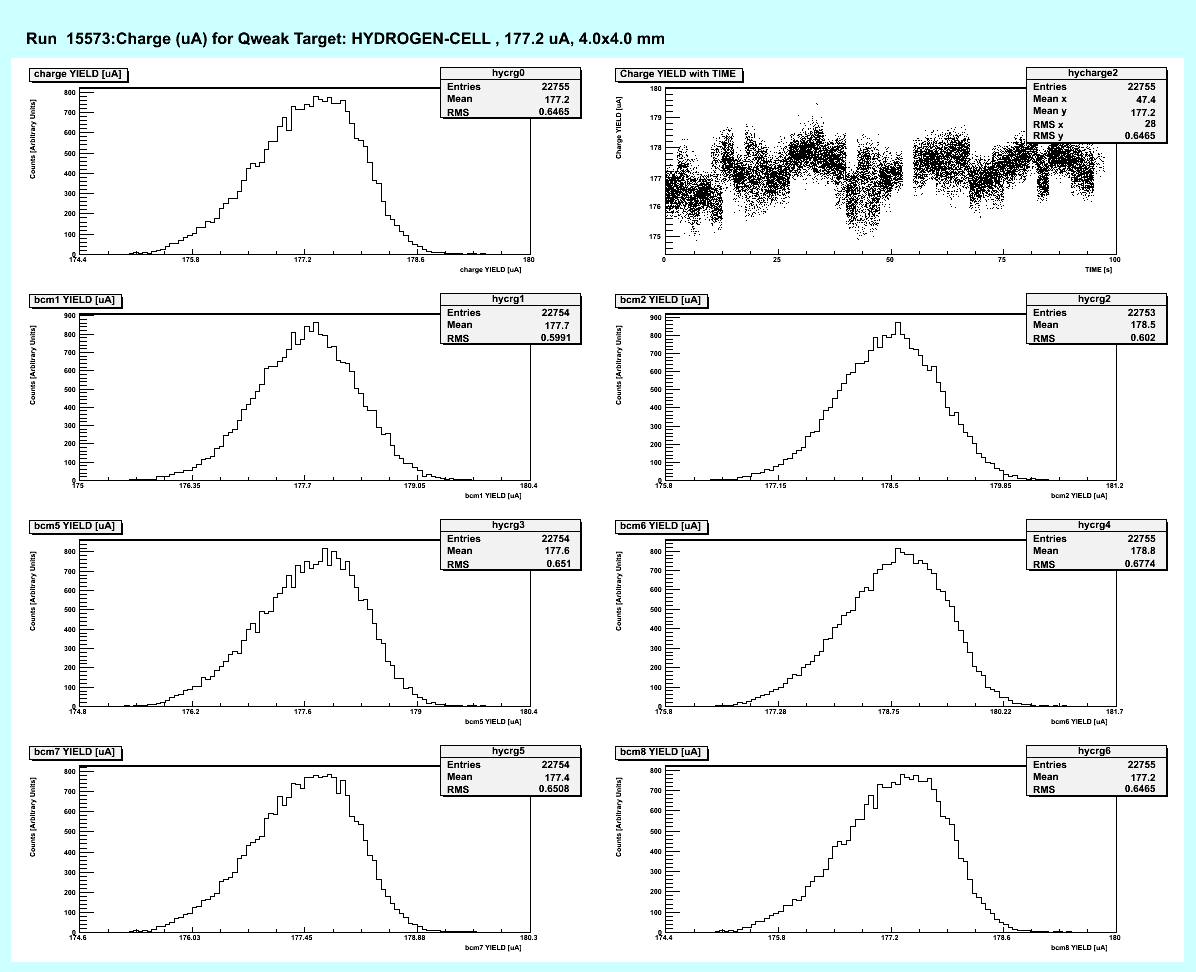
FIGURE 2
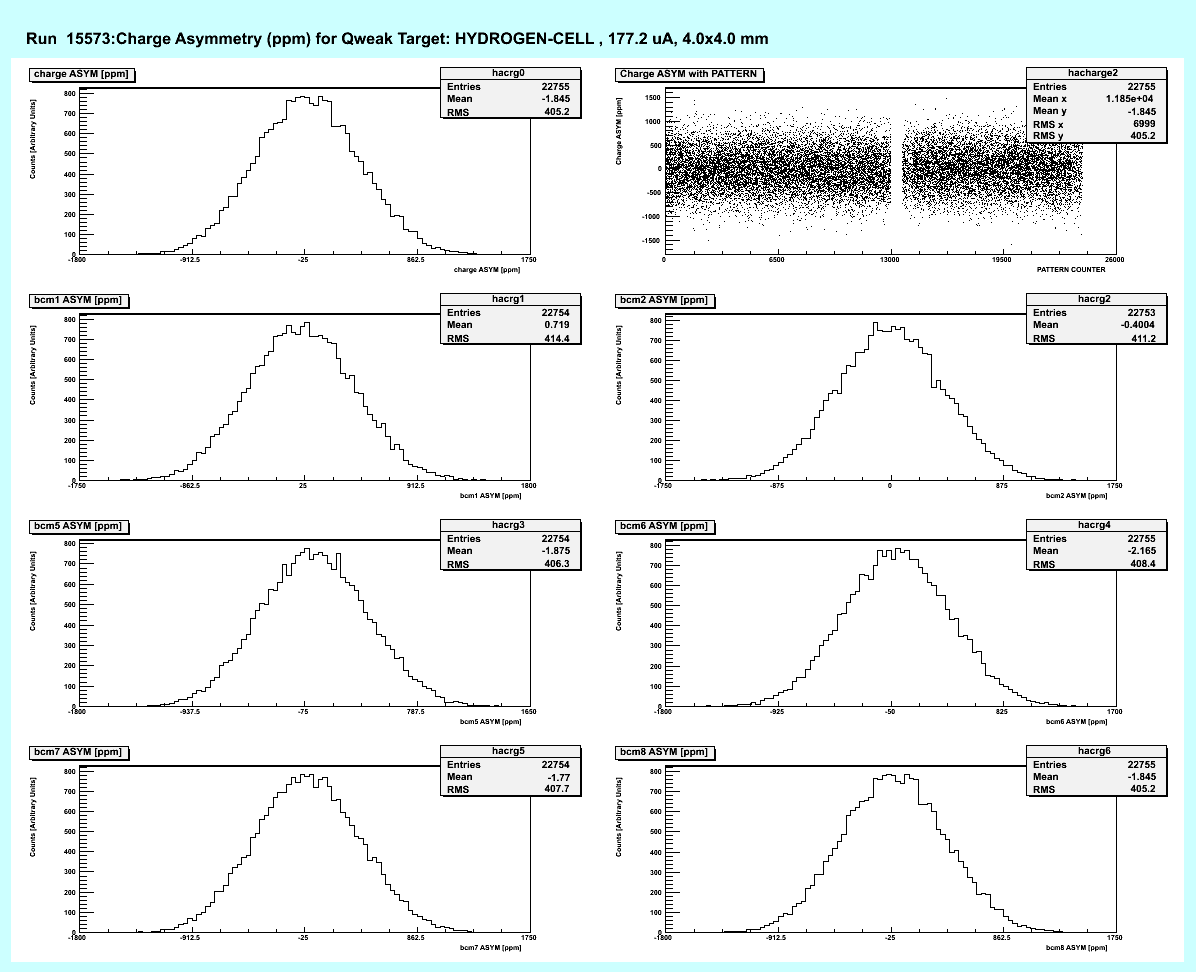
FIGURE 3

FIGURE 4

FIGURE 5
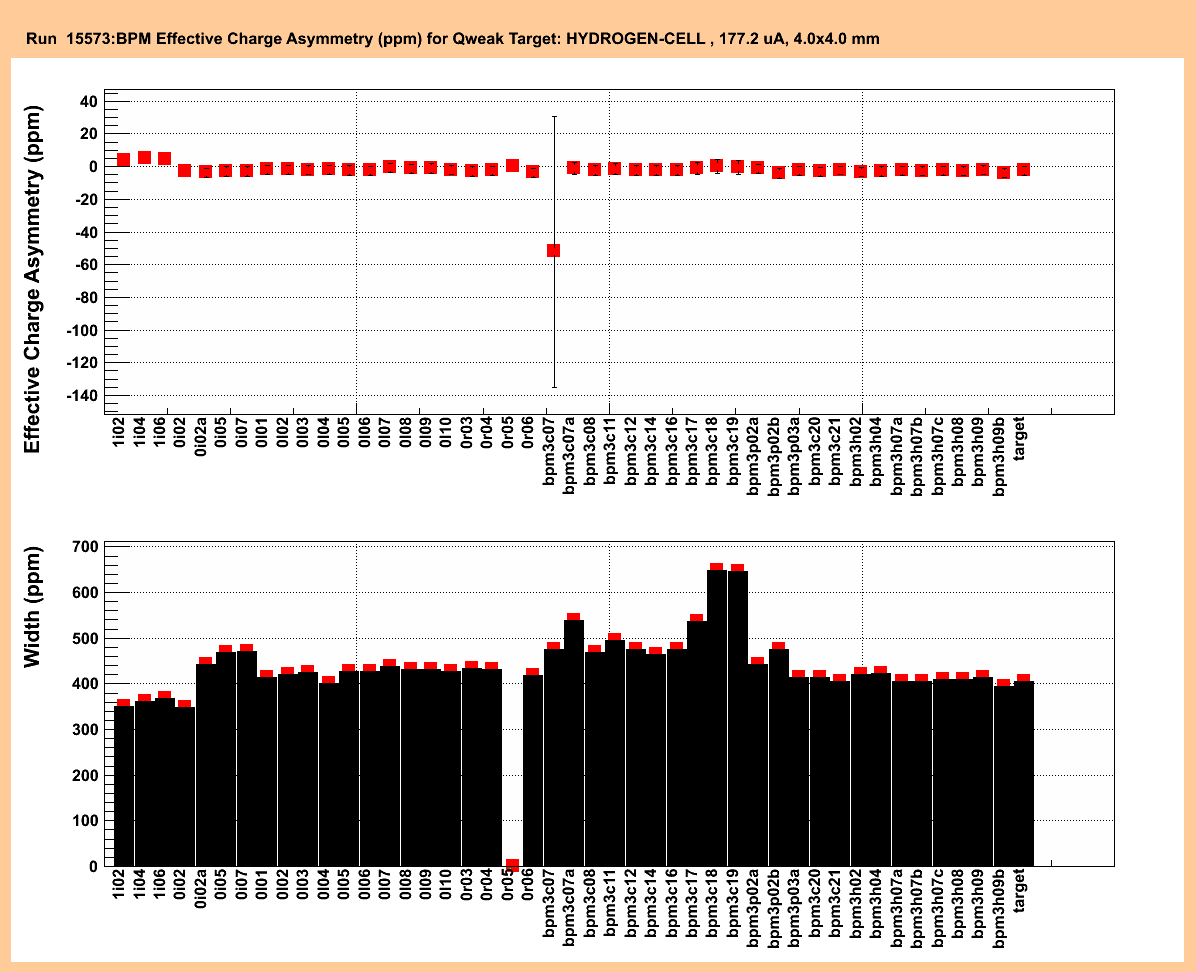
FIGURE 6

FIGURE 7
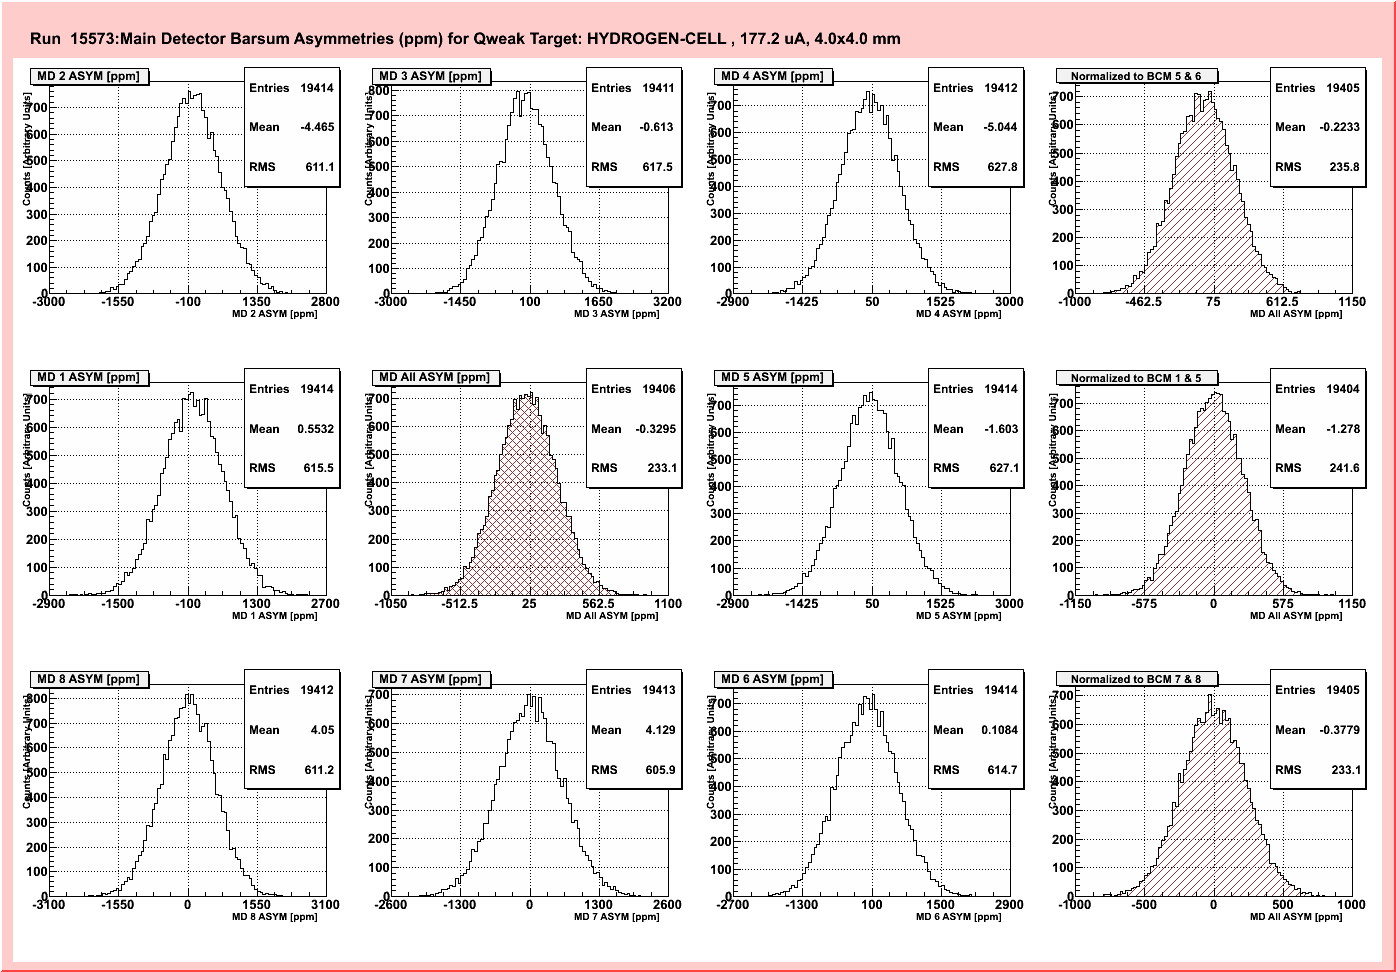
FIGURE 8
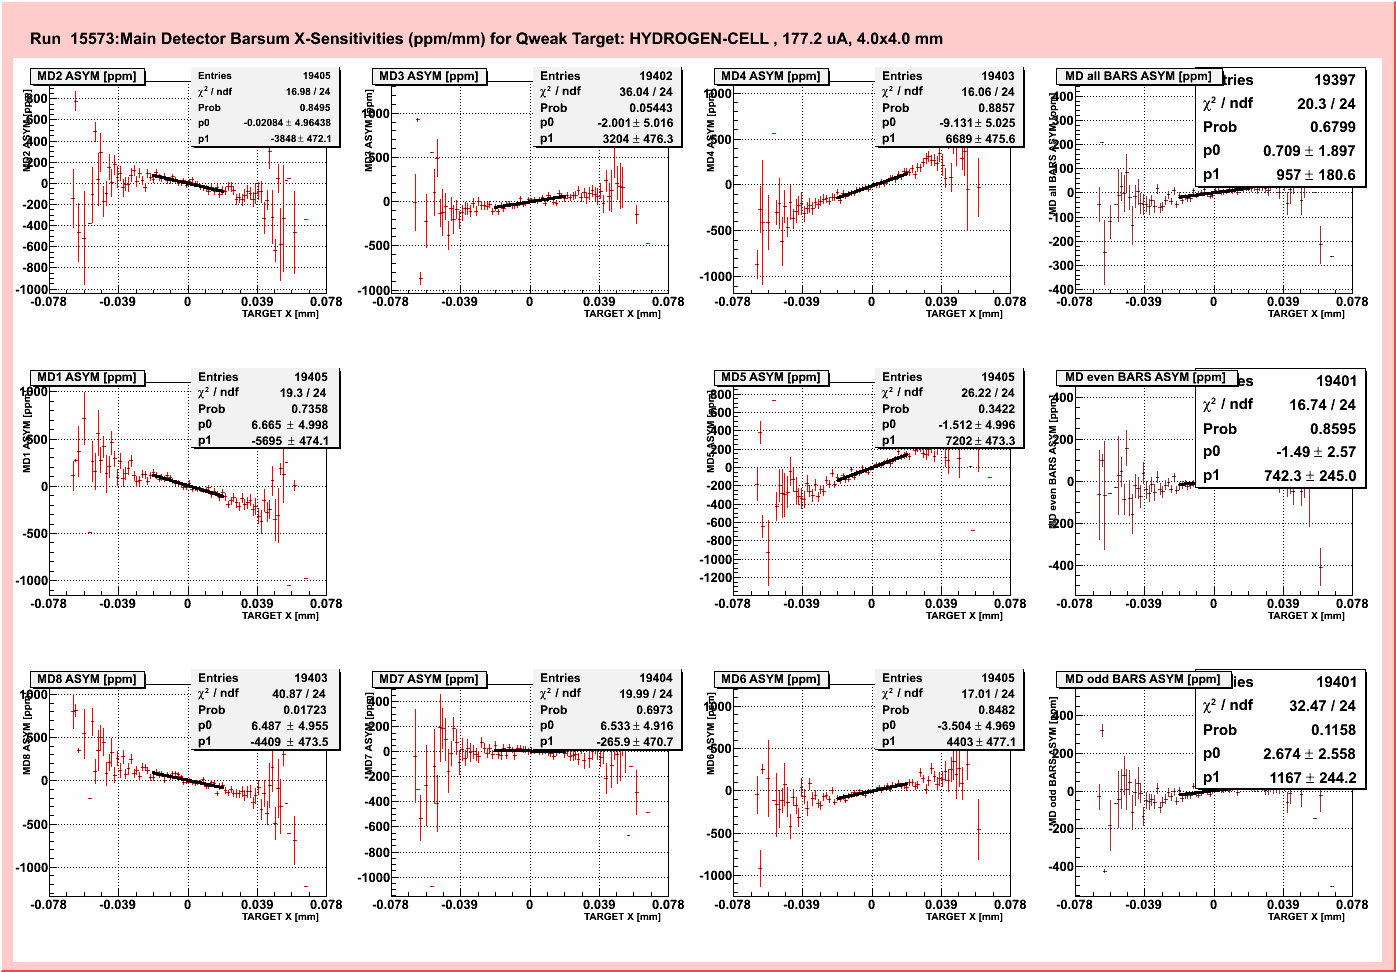
FIGURE 9

FIGURE 10

FIGURE 11
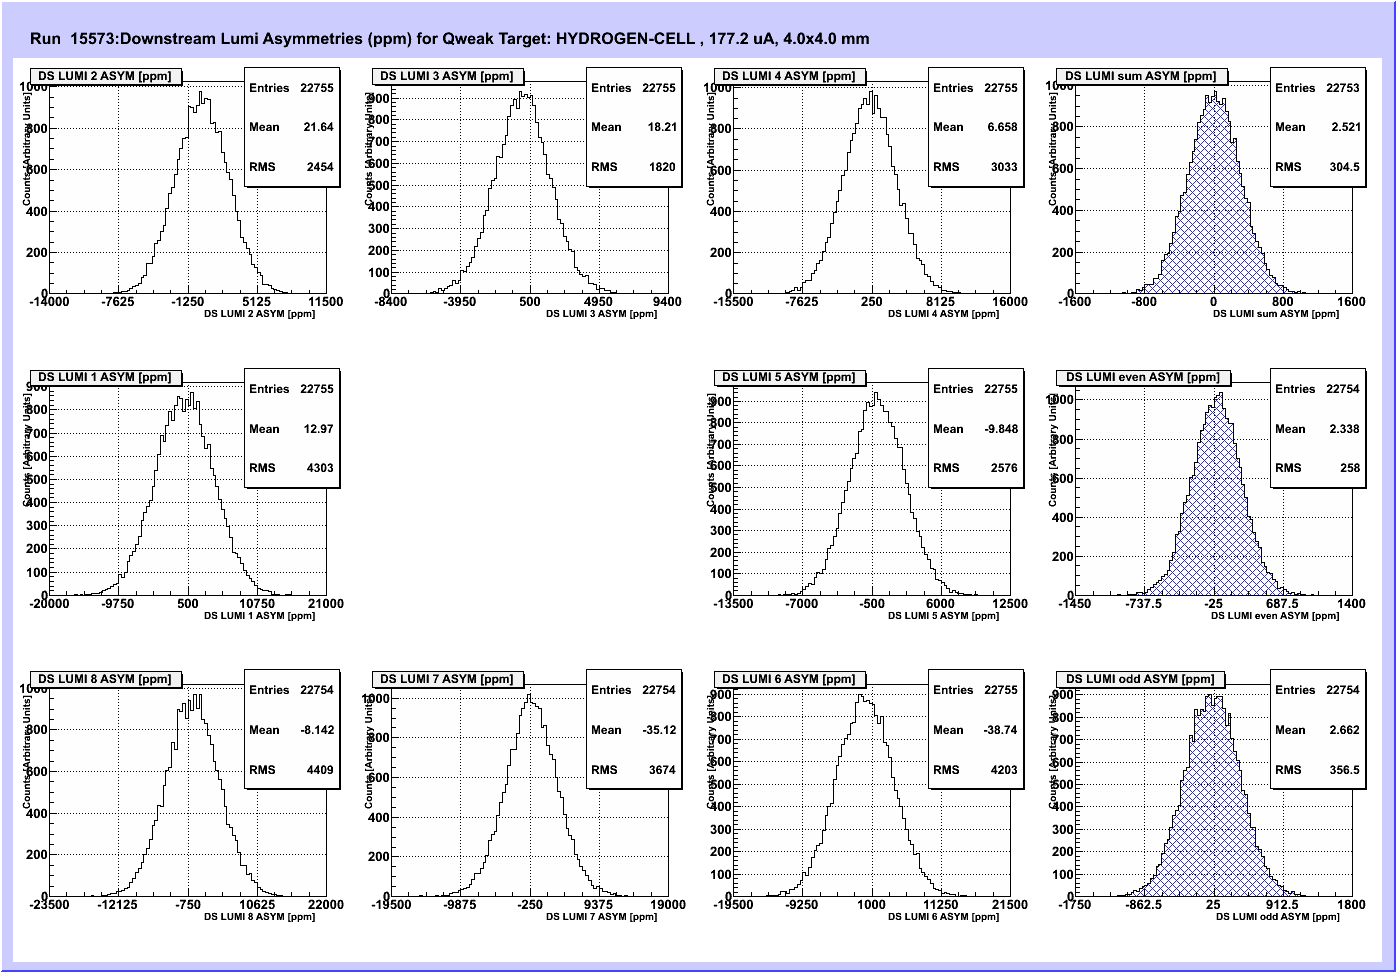
FIGURE 12

FIGURE 13

FIGURE 14

FIGURE 15

FIGURE 16
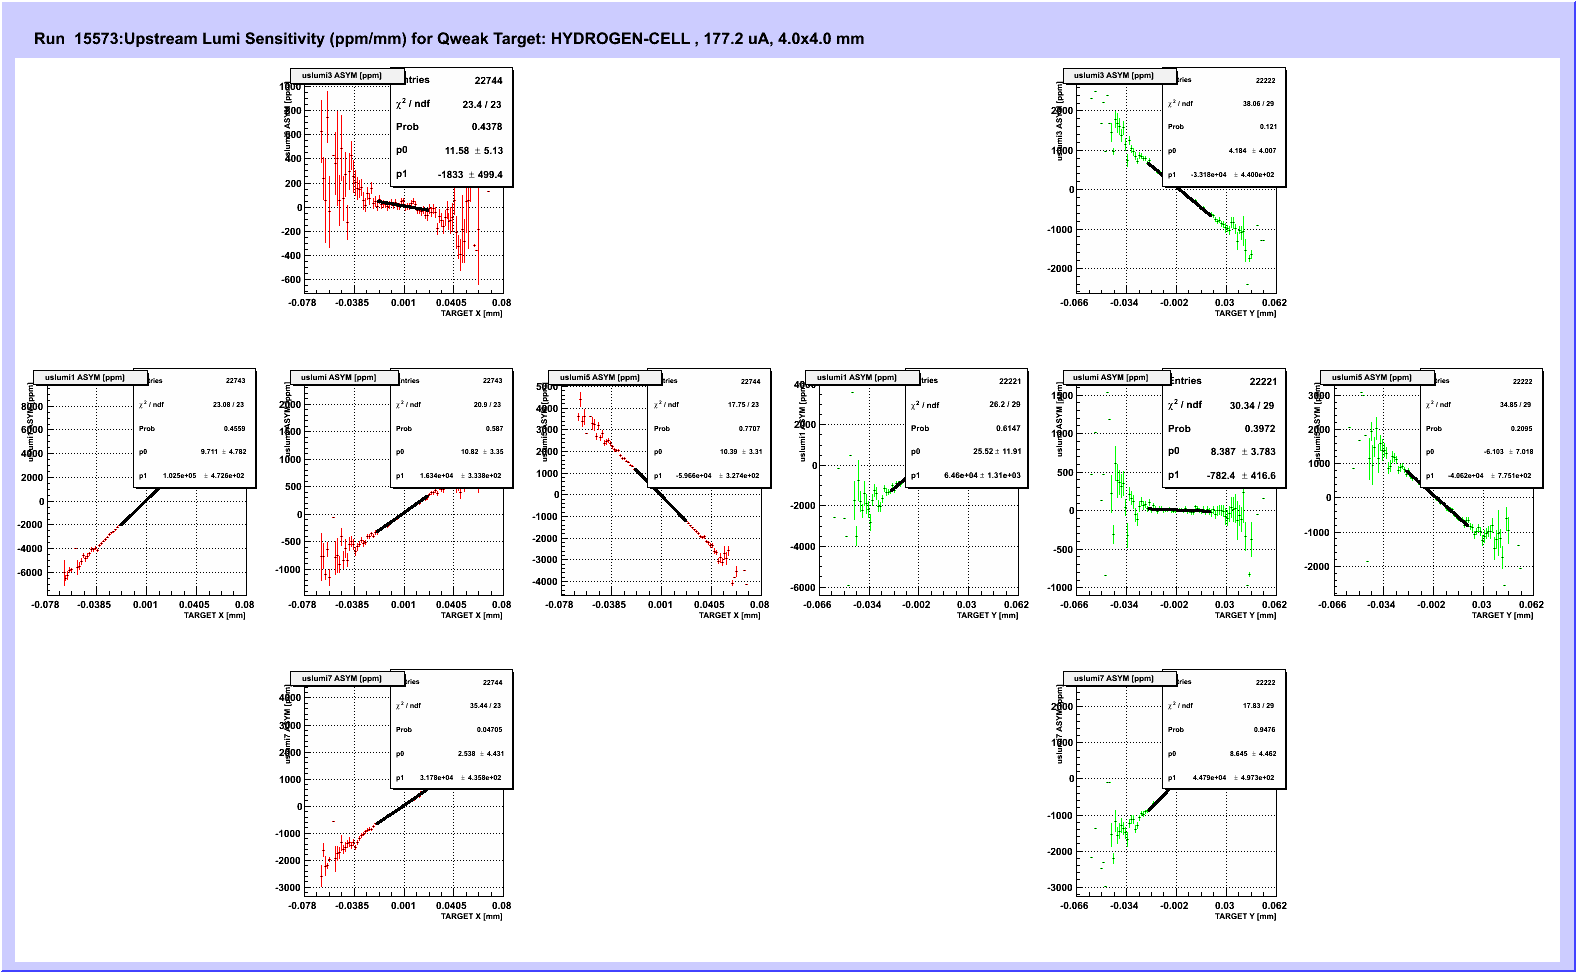
FIGURE 17
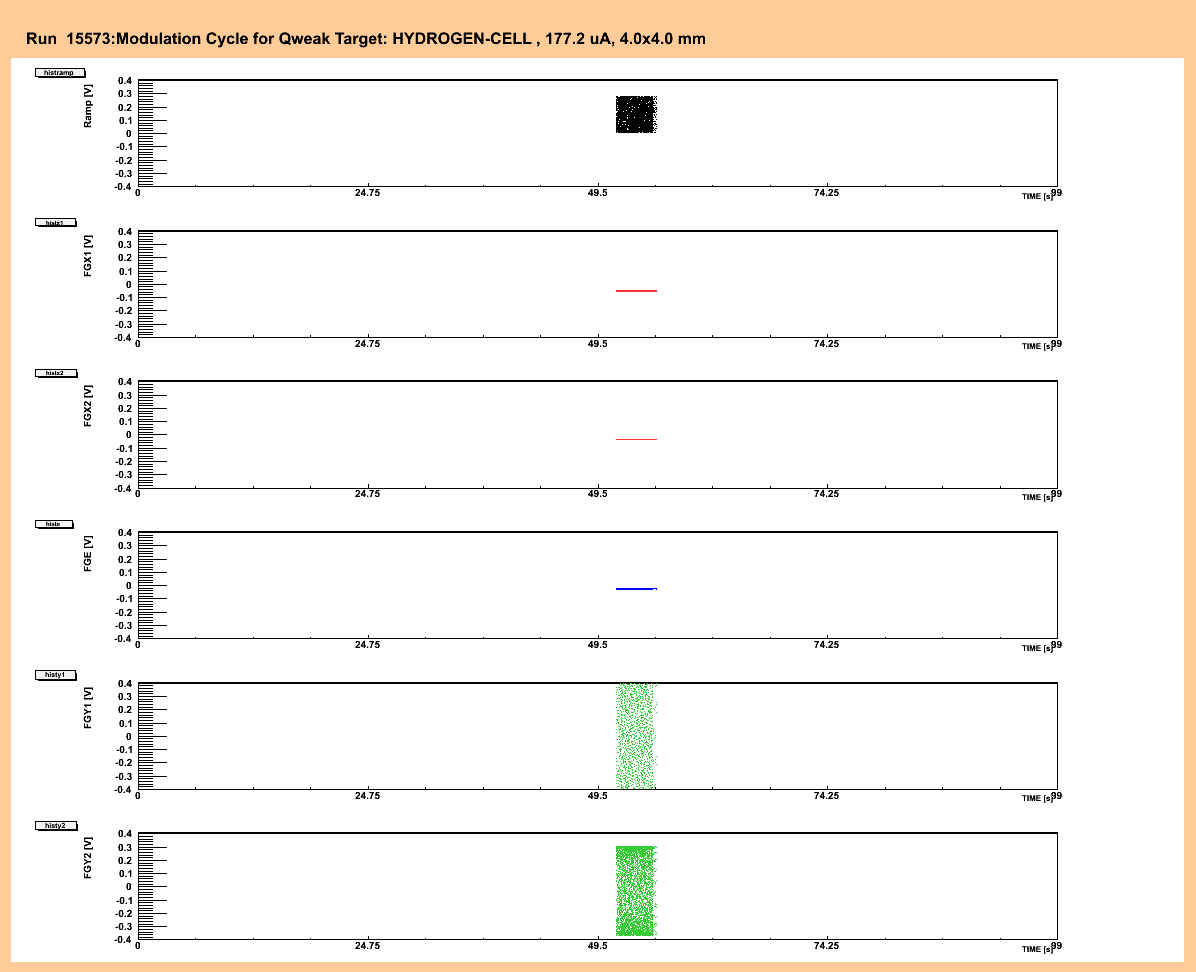
FIGURE 18

FIGURE 19

FIGURE 20
