Main INDEX,
Monthly INDEX,
PREV,
NEXT
Make New Entry,
Make Followup Entry (Advanced)
User name Pitt
Log entry time 13:18:09 on February 26, 2012
Entry number 255716
Followups:
keyword=Background/USLUMI asymmetries and widths and recent MD (IN+OUT)/2 value
I have two primary points in this log entry:
- In the new Wien state (R) - Wien 9 - that we have been running in for the past week, we seem to have a ~ 2 sigma (IN+OUT)/2 problem for the MDs. We need a few more days to see if this is a statistical fluctuation or is statistically significant. But I wanted people to be aware so they can be thinking about what we might do if it persists.
- The (IN+OUT) problem (if it is real) seems to be correlated with what we are seeing in the background and upstream lumi detector asymmetries for the past week. Also, from looking at the data for the past 2 months, I think the upstream lumi asymmetry width could potentially be a useful diagnostic for whether we have a good tune or not; it is very sensitive and during the period of the Jan. - Feb. when it was smallest, the upstream lumi and background detector asymmetries were consistent with zero. It responded very strongly to the laser phase episode of this morning. I think a deliberate systematic study of our experiment versus several laser phase settings - as I think Paschke and Dalton have been suggesting - would be very worthwhile. We can see if the upstream lumi widths have changed instantly from the 100k file; if we do an hour at each setting we will have adequate (~ 3 ppm for background detectors, ~ 1 ppm for lumis) to study some of the large asymmetries we appear to be seeing in those detectors.
(IN+OUT)/2 for MD in the current Wien state - R The attached Figure 1 - taken straight from the QWAC summary page - shows a (IN+OUT)/2 value of ~ -74 +/- 37 ppb - a 2 sigma deviation from zero for the usual 5 parameter MD regression. The separate asymmetry values are In_R = 112 +/- 50 ppb and Out_R = -259 +/- 54 ppb. Note that this is a different Wien state (Right) than the famous "Wien 5" (which was Left). Also, the seemingly problematic value in this case is "In", while in the Wien 5 case it was "Out". This represents about 7 days of data; so I guess we need about another 7 days of data to see if this is a 3 sigma effect.
Uslumi and Background detector asymmetries during January - February 2012 Figures 2 and 3 are the output of the QwDBGUI for good production hydrogen runs during the January - February 2012 period. Important caveat: For pmtltg and pmtonl, one needs to ignore them prior to ~ run 15600 when they were setup in a different mode. I included those runs because I wanted the horizontal scales to be the same for both uslumis and background detectors for easy comparison. For the same reason, one has to ignore the averaged values in the boxes for pmtltg and pmtonl for the Wien left state.
There are several points about these plots:
- For the current Wien state (Wien 9), we have significant non-zero asymmetries in the background detectors (including MD9 that has lead on it like the main detectors). The asymmetries are bigger - by about a factor of 4-5 for IN vs. out. Specifically, for IN, the asymmetries are: MD9BARSUM: -1.2 +/- .3 ppm; PMTLTG: -18 +/- .6 ppm; PMTONL:-13 +/- .7 ppm; USLUMISUM: -9 +/- .2. These are all negative. If the MD had a smaller false asymmetry from this - of the same sign - then it would cause IN to be reduced in magnitude (since it is positive) which is consistent with what we are currently seeing.
- The USLUMISUM asymmetry width can be stable for long periods of time, and then it shows discrete jumps associated with well known tuning events. For example, at run 15850 we the "M56" optics change. There the USLUMISUM asymmetry widths suddenly dropped from ~ 450 ppm to ~ 250 ppm. After that, we did transverse running which is not captured in this plot. Then when we came back to Wien Right - Wien 9 - the widths were up to a consistent ~800 ppm. Yesterday, they jumped up really high - to ~ 1200 ppm - and that was consistent with the other problems - increased tungsten plug temperature, increased ion chamber rates - we had yesterday. One can see in the last two blue points in that plot the improvement that was obtained this morning - back to "normal" of ~ 800 ppm for Wien 9, but still much bigger than the great 250 ppm we had during Wien 8.
- A significant fact is that the short period of time during this Jan. - Feb. period when the USLUMISUM asymmetry widths were smallest (~ 250 ppm), the uslumi and background detector asymmetries were consistent with zero. That is apparent if you look at the plot. The numerical values to support it are in my talk at the collaboration meeting. Basically that talk was done a few days after the M56 tune change, and up to that point all of the uslumi and background detector asymmetries that had been annoyingly non-zero earlier were all consistent with zero.
- The improvement in the uslumis right after the M56 tune was also apparent in how the uslumi asymmetry widths looked around the azimuth. I attach two 100k output plots; one from recently and one from the good M56 period. From recently, one can see a significant left-right difference in the asymmetry width:uslumi1 has a width of ~ 1271 ppm and uslumi5 has a width of ~ 3713 ppm. On the other hand, from the good M56 period (Figure 5) the widths were nicely balanced: uslumi1 ~ 913 ppm and ulsumi5 ~ 858 ppm. For that run, the ~ 3 times larger width for the left-right (1/5) uslumis versus up-down (3/7) uslumis is the 3 times larger X position difference width than Y. I'll ask Wade Duvall to look into these individual lumi asymmetry widths for the regressed data.
A copy of this log entry has been emailed to: crowder,opper,carlini,armd,mack,paschke,dalton,rajotte,smithg,benesch, pitt,wsduvall
Figure 1: (IN+OUT)/2 during this Wien state
Figure 2: Uslumi asymmetries and widths during Jan. Feb. 2012

Figure 3: Background detector asymmetries and widths during Jan. - Feb. 2012

Figure 4: Recent (today) upstream lumi 100k file
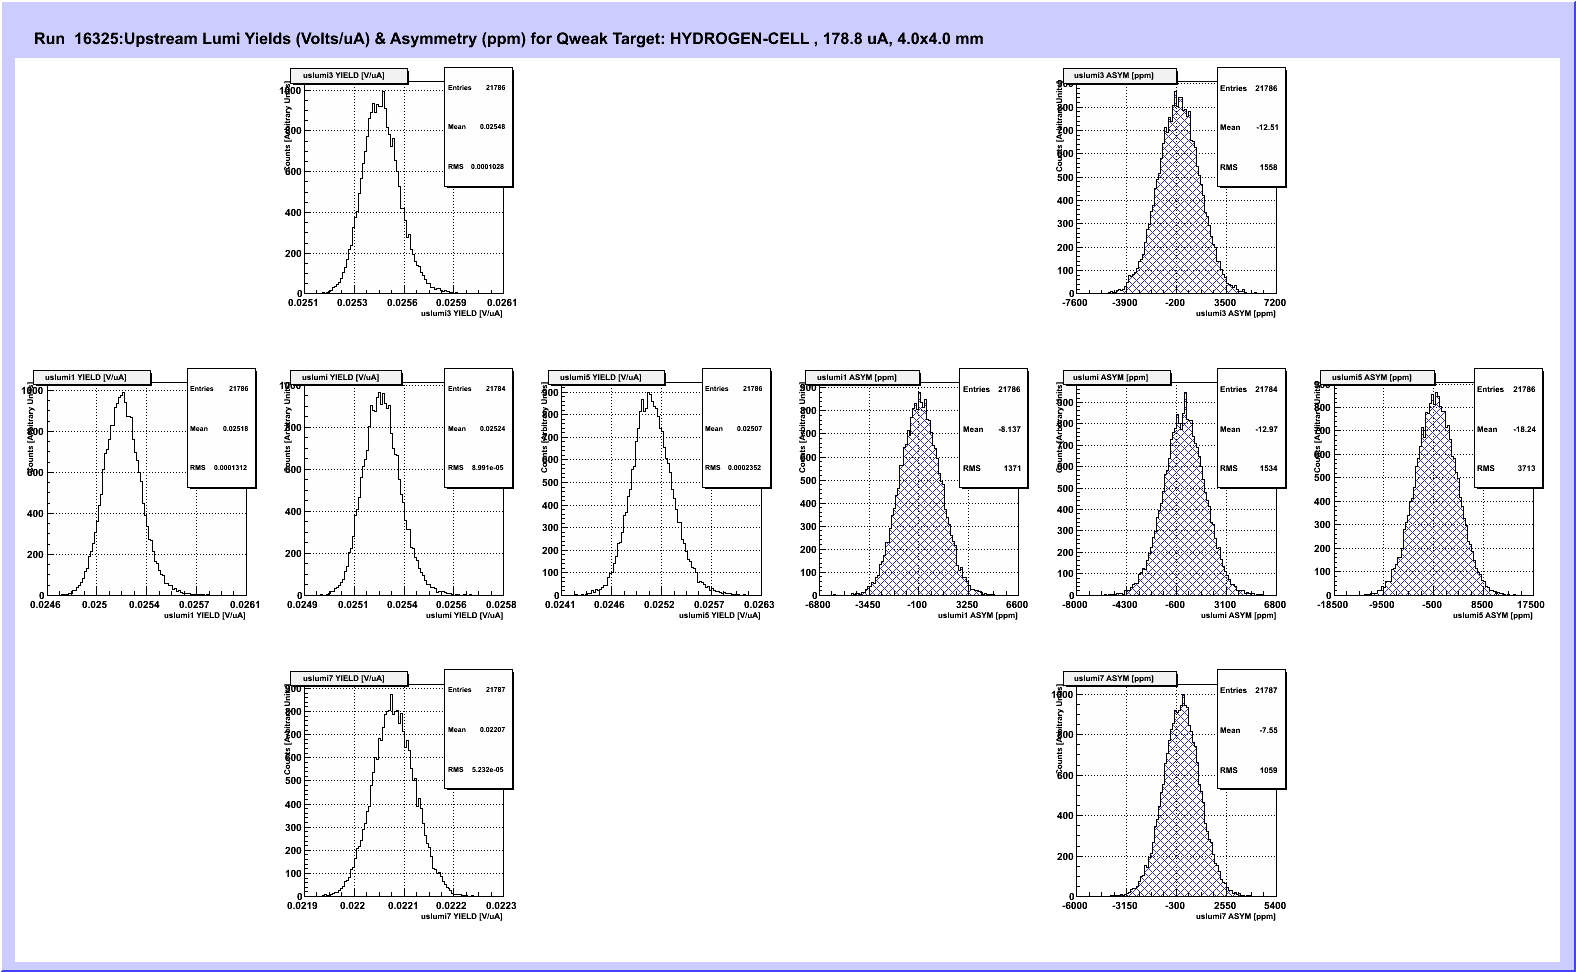
Figure 5: Upstream lumi 100k file from "good" M56 period
