User name C. Armstrong
Log entry time 23:51:17 on July 15,1999
Entry number 14293
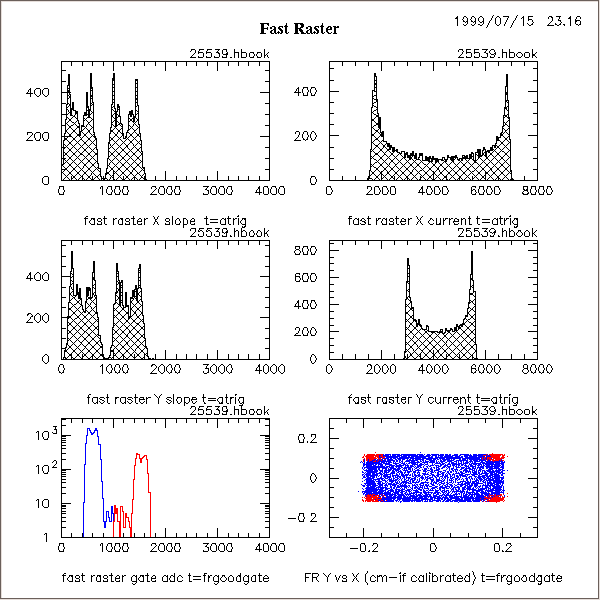
keyword=Raster gating!Below (lower right plot) is a picture of the raster distribution, where the red guys in the corners are flagged by the raster gating signal in the datastream. The plot on the lower left shows the ADC values for the gating signal, from which you can see that roughly 16% of the events are gated out. This corresponds to a 40% mask on X ANDED with a 40% mask on Y (0.4 x 0.4 = 0.16).
We can also see roughly 16% of the clock scaler gated away (gen25539.txt):
Time of run = 41.55 sec.
Gated Time = 35.53 sec.
and likewise for the gated charge:
I_avg Q_tot Q_tot
(microAmps) (microCoulombs) (microAmp-hours)
BCM1 11.753 488.376 0.136
BCM2 11.510 478.305 0.133
BCM3 11.509 478.247 0.133
gated BCM1 11.587 411.689 0.114
John A correctly points out that we should in principle be creating gated versions of some other scalers, such that we can create gated versions of efficiency and deadtime.
FIGURE 1
