Elong-13-05-28
Systematic Error Bars
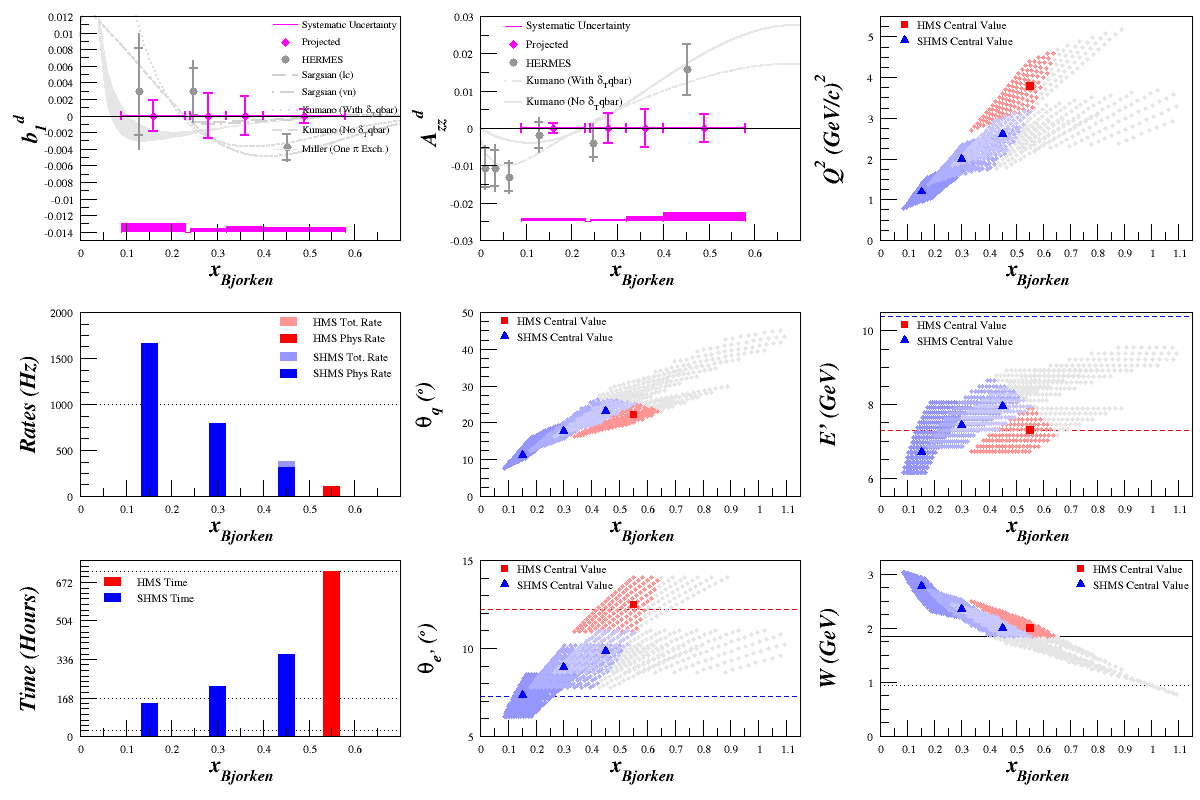
9.2% Systematic Uncertainty
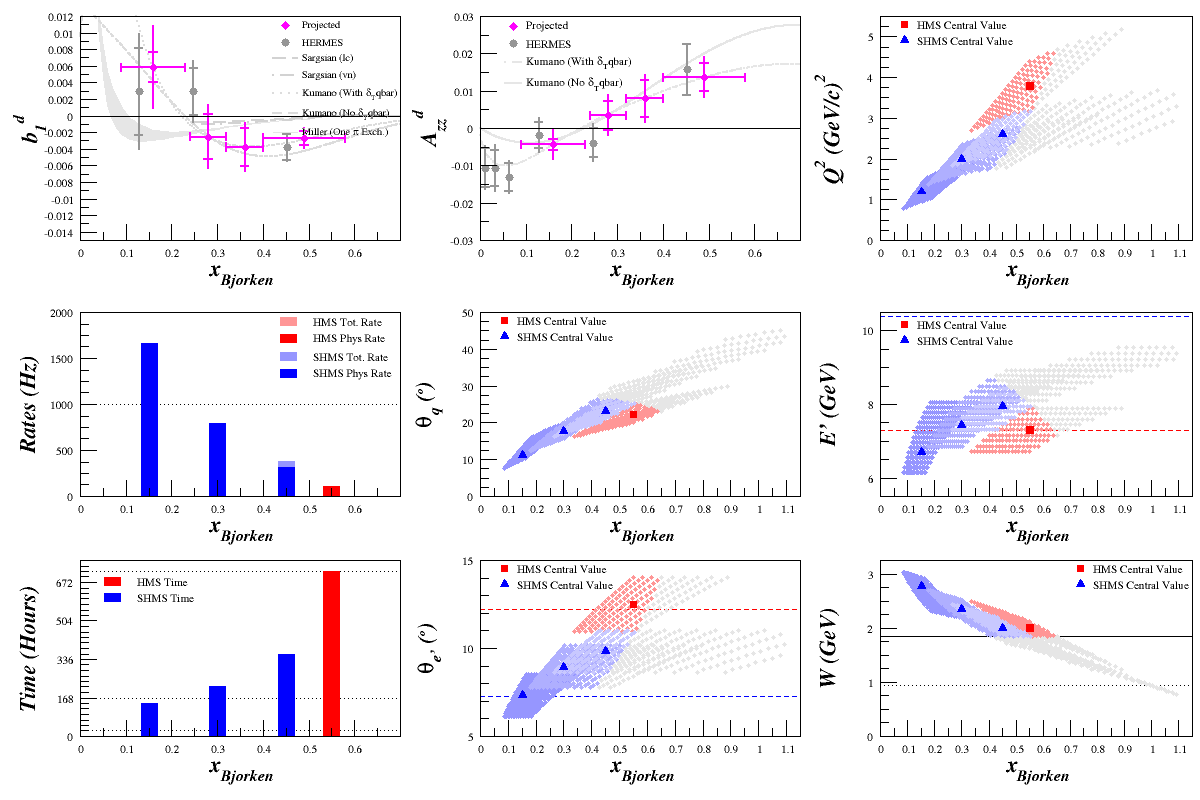
From Dustin's work for the proposal, the components to systematic uncertainty make up a relative systematic uncertainty of 9.2%. Plotting this ($\delta A_{zz}^{sys} = 2\left(0.092 \cdot A_{zz}\right)$) as an error band, and propagating it to $b1$, we get the plot below.
Including Drift
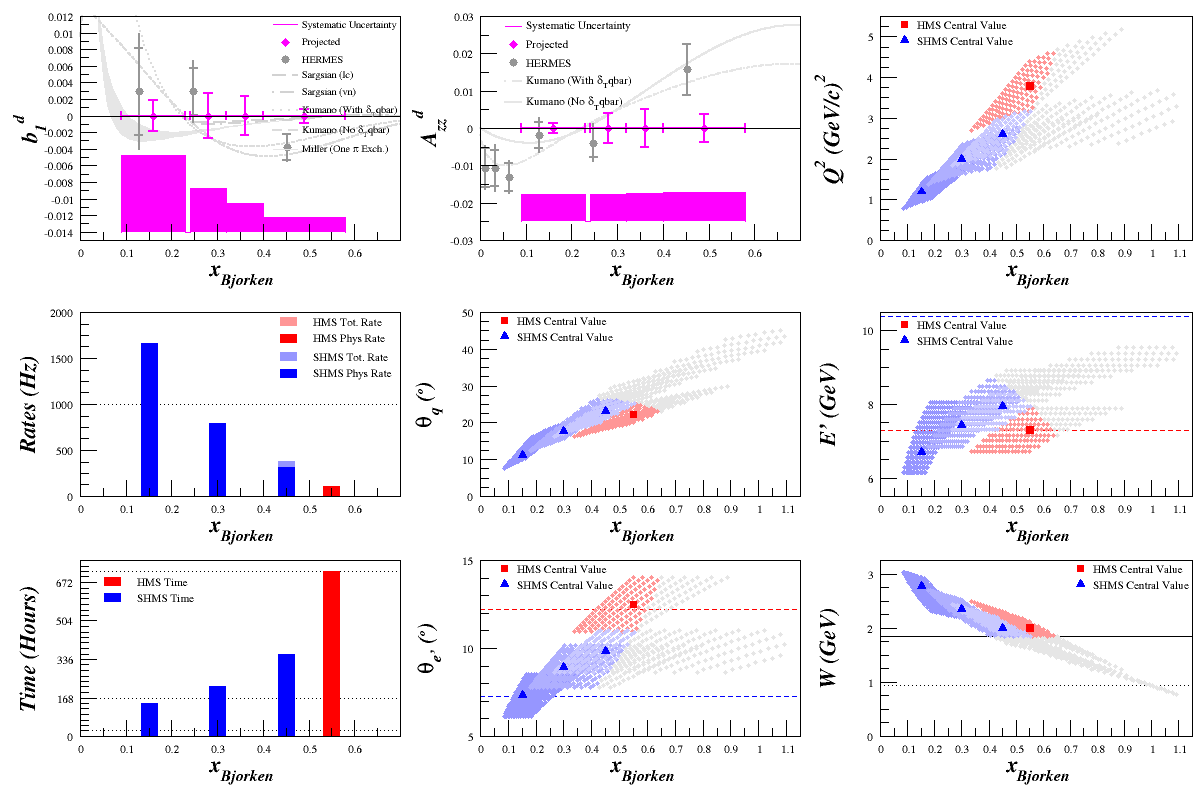
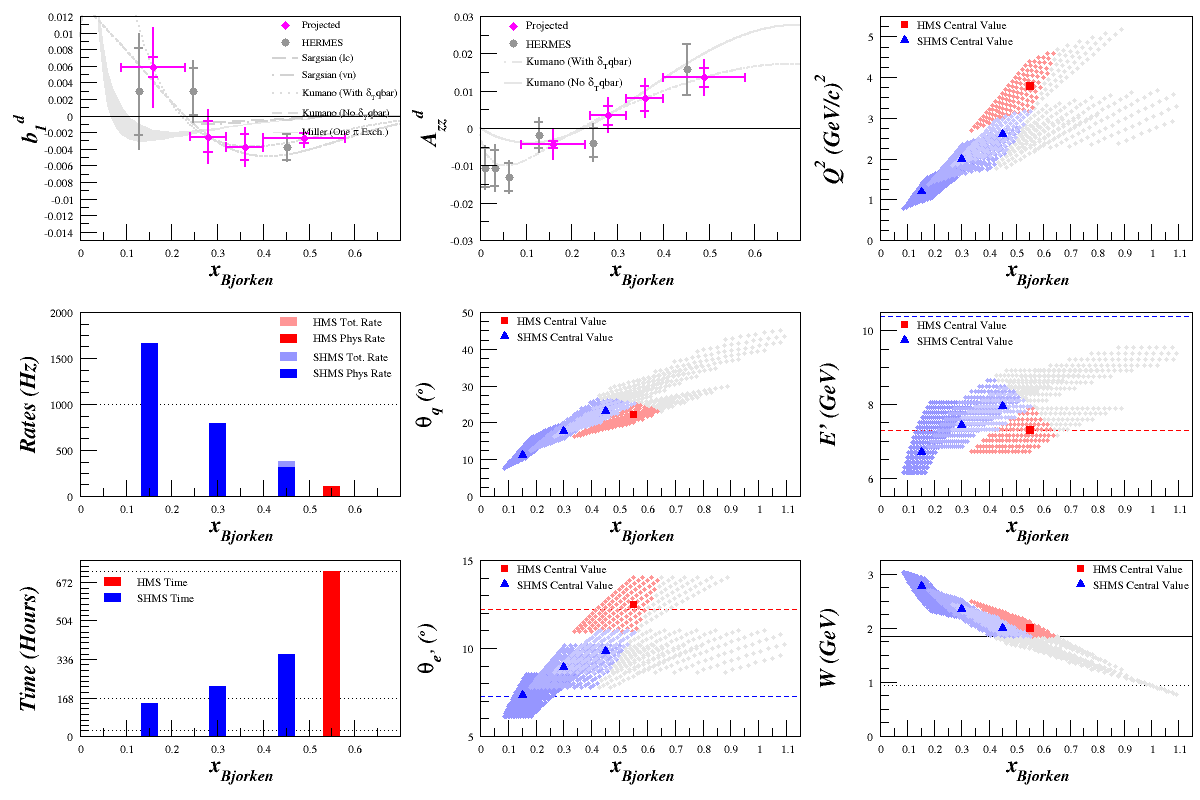
Additionally, there is a compoment due to drift that makes up $\delta A_{ZZ}^{drift}=\pm \frac{2}{fP_{zz}}\delta \xi = \pm 3.7 \times 10^{-3}$. Including this, $\delta A_{zz}^{sys} = \pm \sqrt{\left(0.092 \cdot A_{zz}\right)^2 + 0.0037^2 }$, the error band expands as in the plot below.
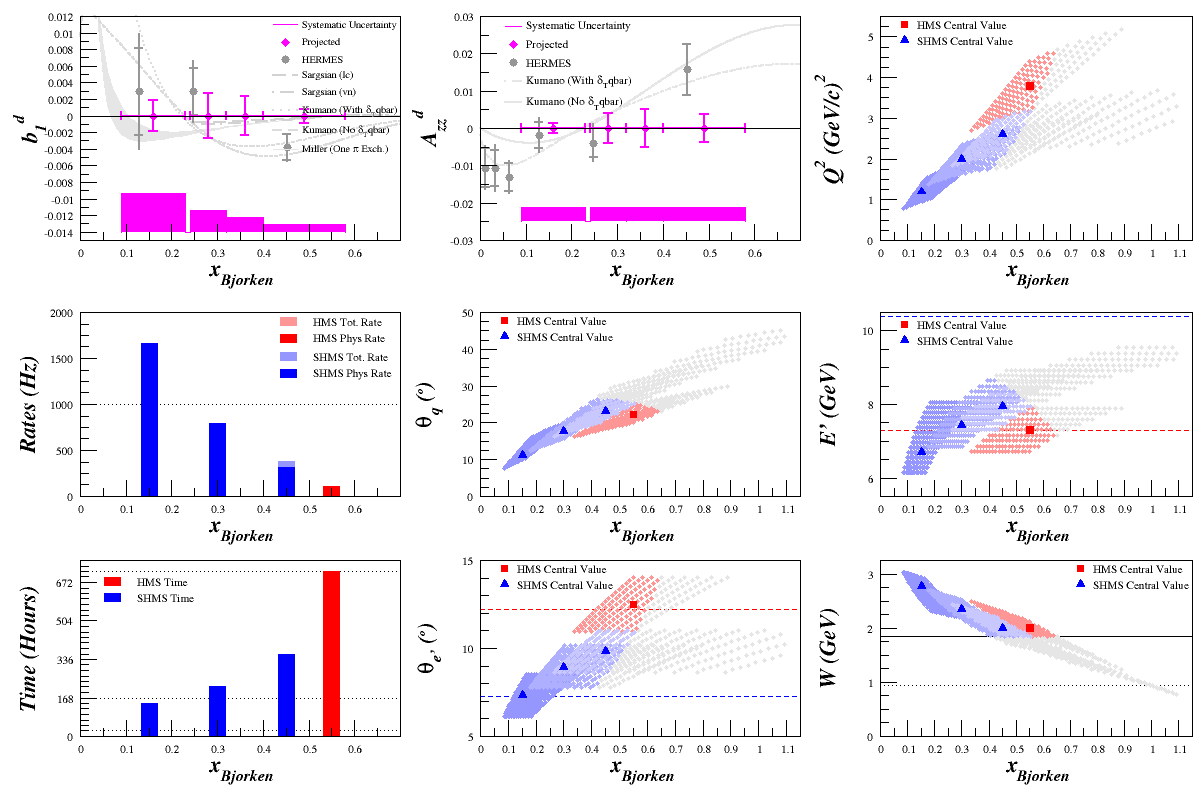
The above image is includes the entire $\pm\delta A_{zz}^{sys}$ range. If we only want to show half that (just $\delta A_{zz}^{sys}$ instead of $\pm \delta A_{zz}^{sys}$), it looks like:
Full Error Bars
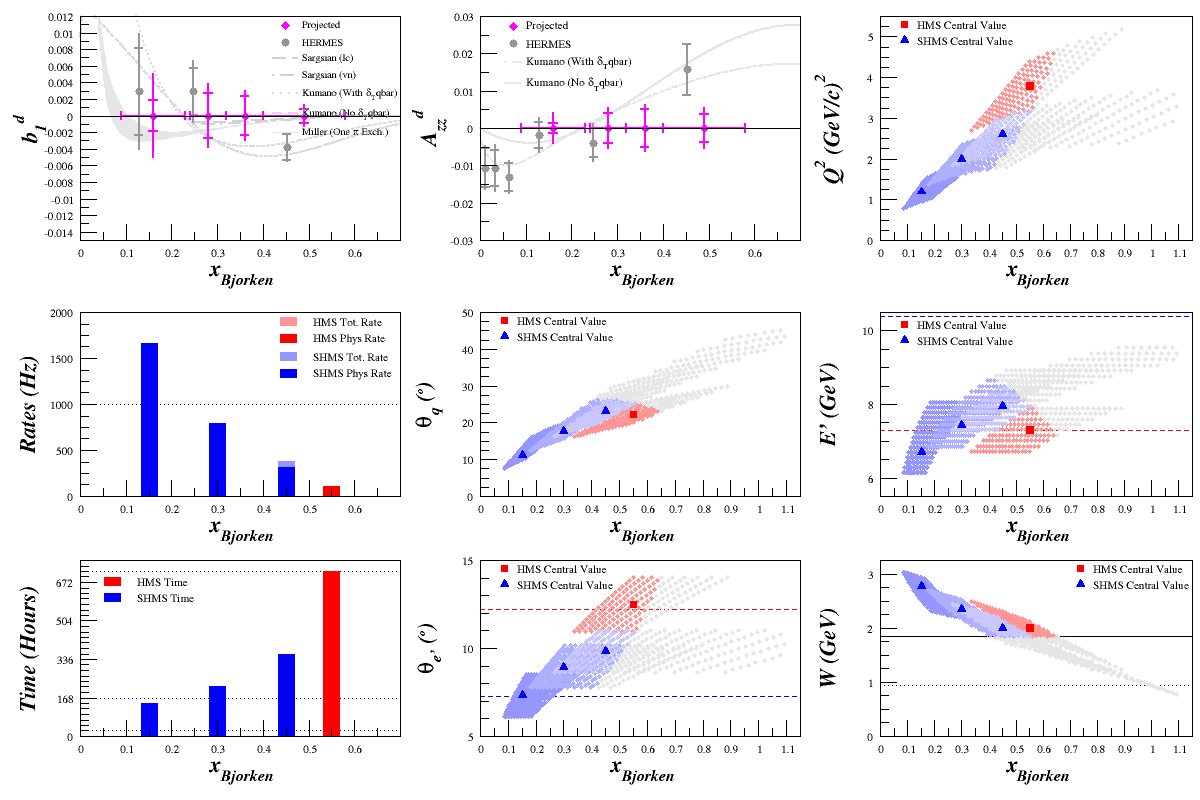
If we put this as $\delta A_{zz} = \sqrt{\delta A_{zz}^{(stat) 2} + \delta A_{zz}^{(sys) 2}}$ as bars on the points, it comes out to the plot below. Our dominating effects are statistics and charge/efficiency fluctuations.
The Rates and Systematic Uncertainty Calculations for a Measurement of $A_{zz}$ tech note has been updated to include this band.
20% Pzz:
30% Pzz:
Bouncing between 20% Pzz and 30% Pzz:
--E. Long 17:23, 29 May 2013 (UTC)
