Difference between revisions of "Elong-13-05-02"
From HallCWiki
Jump to navigationJump to search| (5 intermediate revisions by the same user not shown) | |||
| Line 2: | Line 2: | ||
Rates code now matches what Patricia gets. The issue was in the spectrometer acceptance -- I was using a larger acceptance based on old calculations of what the SHMS could do. This has been fixed, the points on Azz and b1d have been moved to the central x value that the range is over, and the dark points on the kinematics plots show where the spectrometers will sit. This is using [[Elong-13-05-01-Azz-Method-2#Azz_Formalism_-_Method_2|what I've called Azz method 2]] to calculate the uncertainties. | Rates code now matches what Patricia gets. The issue was in the spectrometer acceptance -- I was using a larger acceptance based on old calculations of what the SHMS could do. This has been fixed, the points on Azz and b1d have been moved to the central x value that the range is over, and the dark points on the kinematics plots show where the spectrometers will sit. This is using [[Elong-13-05-01-Azz-Method-2#Azz_Formalism_-_Method_2|what I've called Azz method 2]] to calculate the uncertainties. | ||
| − | == | + | ==No x Cuts, W>2== |
Cuts: W>2 | Cuts: W>2 | ||
| + | |||
[[Image: 2013-05-02-100percent.png]] | [[Image: 2013-05-02-100percent.png]] | ||
| Line 13: | Line 14: | ||
[[Image: 2013-05-02-loosew.png]] | [[Image: 2013-05-02-loosew.png]] | ||
| − | == == | + | ==Current Best Numbers== |
| + | f_phys=f_calc*0.95 | ||
| + | |||
| + | ''W''>1.85 | ||
| + | |||
| + | Rebinned ''x'' values so that they correspond to the ±''x'' error bars shown. For the highest two points, the SHMS and HMS data have been combined. | ||
| + | |||
| + | '''[http://nuclear.unh.edu/~elong/analysis_files/2013-05-05/ The best plots in vector format can be found here.]''' | ||
| + | |||
| + | [[Image: 2013-05-02-current-best.png]] | ||
| + | |||
--[[User:Ellie|E. Long]] 20:59, 3 May 2013 (UTC) | --[[User:Ellie|E. Long]] 20:59, 3 May 2013 (UTC) | ||
Latest revision as of 17:41, 5 May 2013
Rates Update
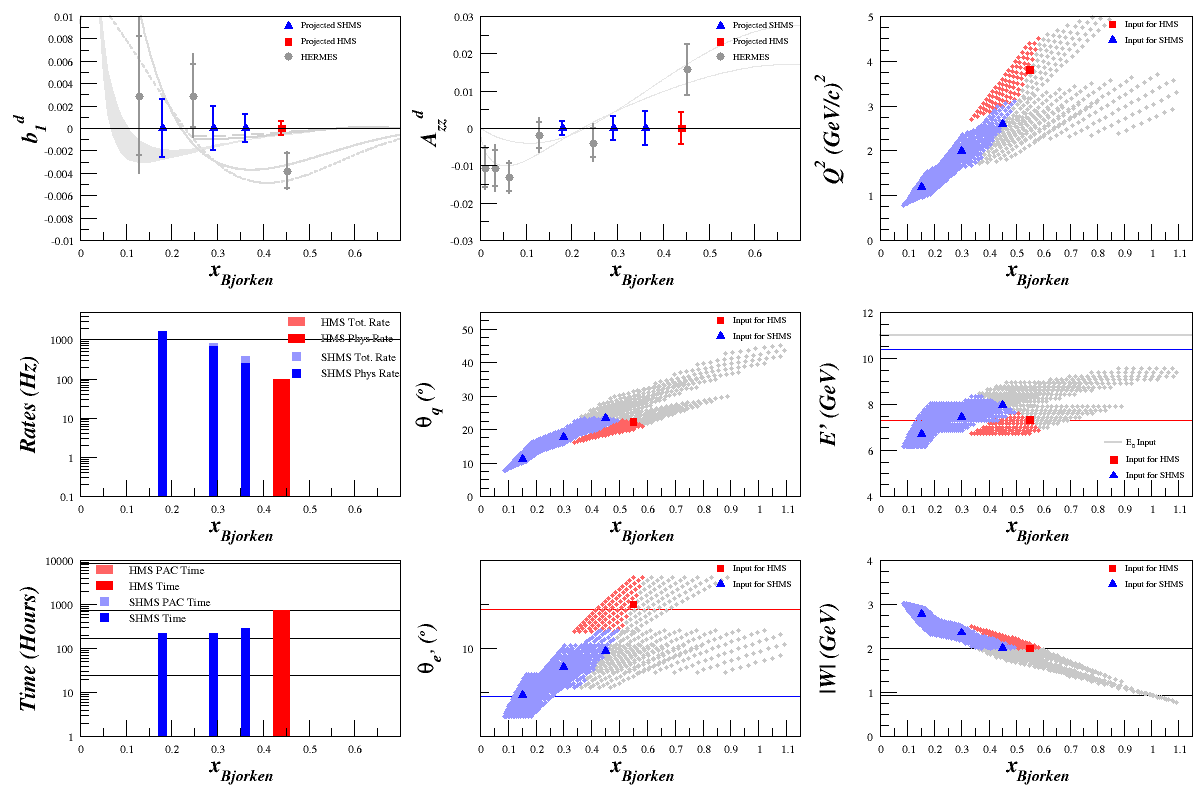
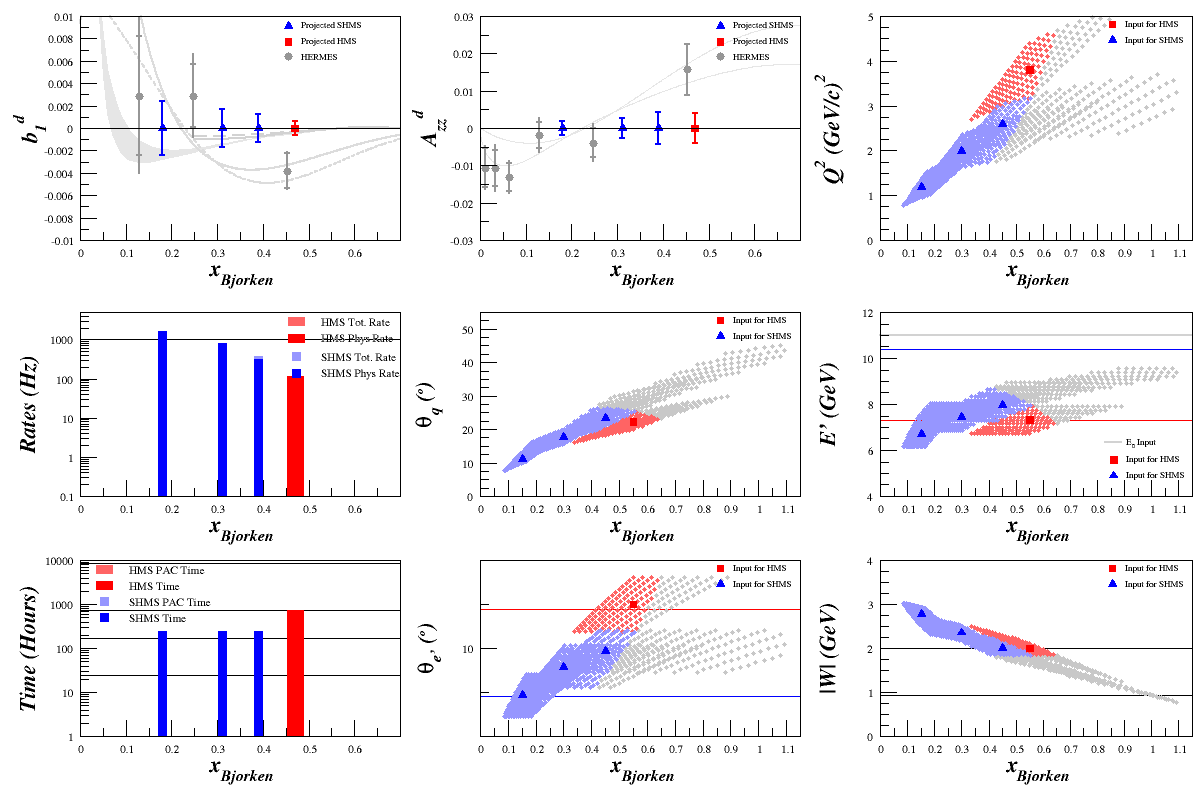
Rates code now matches what Patricia gets. The issue was in the spectrometer acceptance -- I was using a larger acceptance based on old calculations of what the SHMS could do. This has been fixed, the points on Azz and b1d have been moved to the central x value that the range is over, and the dark points on the kinematics plots show where the spectrometers will sit. This is using what I've called Azz method 2 to calculate the uncertainties.
No x Cuts, W>2
Cuts: W>2
No x Cuts, Loose W cut
Cuts: W>1.85
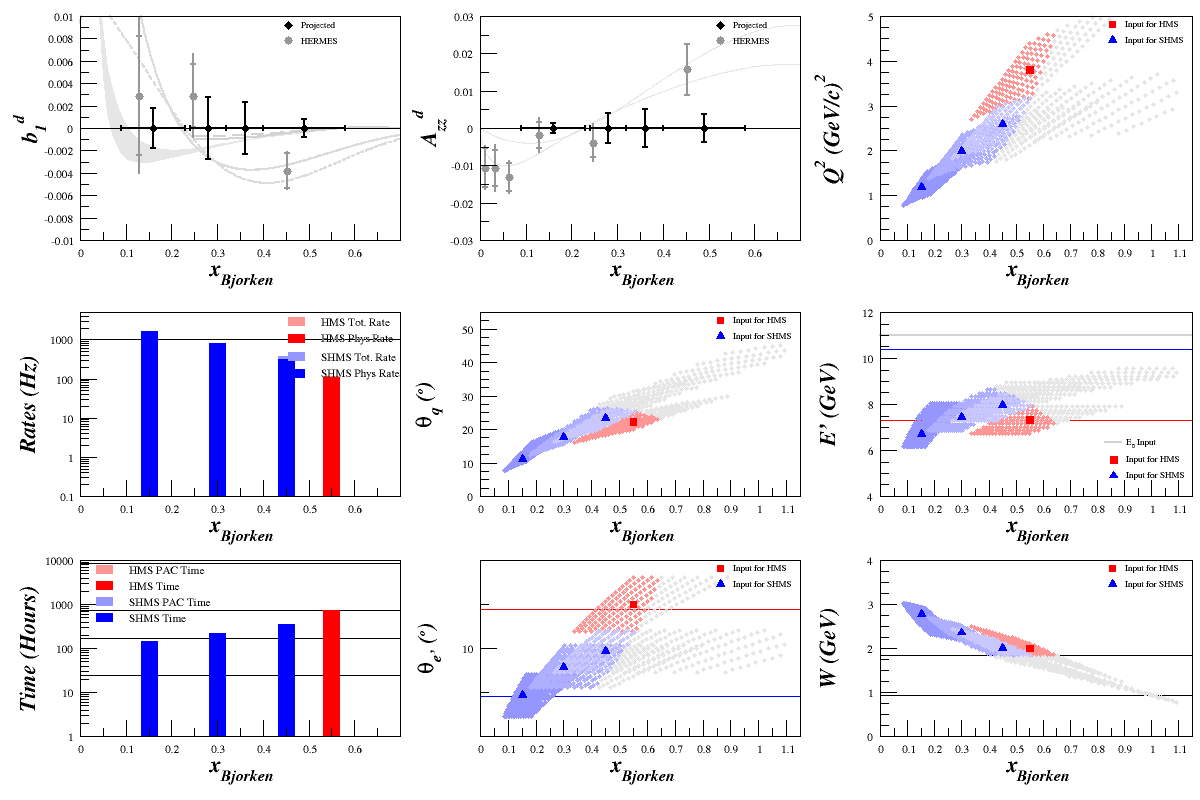
Current Best Numbers
f_phys=f_calc*0.95
W>1.85
Rebinned x values so that they correspond to the ±x error bars shown. For the highest two points, the SHMS and HMS data have been combined.
The best plots in vector format can be found here.
--E. Long 20:59, 3 May 2013 (UTC)


