Difference between revisions of "Elong-13-09-20b"
(New page: ==W Scan and Rates== ===Rates Issue=== There was a rates issue that occurs, not in the statistics, but in the maximum number of events for past plots. They're all of the correct order of ...) |
|||
| (3 intermediate revisions by the same user not shown) | |||
| Line 2: | Line 2: | ||
===Rates Issue=== | ===Rates Issue=== | ||
| − | There was a rates issue that | + | There was a minor rates issue that occurred, not in the statistics, but in the maximum rate for past plots. They're all of the correct order of magnitude, but off by about 10% or so. It was causing the rates in the Rates plot (which was separated from the statistical uncertainty, which was correct) to come out slightly higher than they should have been. This has been corrected. |
===W Scan=== | ===W Scan=== | ||
| Line 24: | Line 24: | ||
| − | --[[User:Ellie|E. Long]] | + | ==Possible Measurement== |
| + | |||
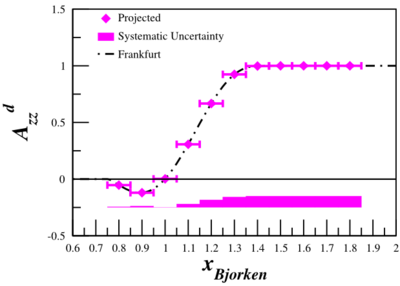
| + | With one week of data and a 6.6 GeV beam, with the HMS at E'=5.80 GeV and 12.45 degrees (Q2=2.45, x_cent=1.20) and the SHMS at E'=6.26 GeV and 7.46 degrees (Q2=1.13, x_cent=1.10), we can obtain a measurement that looks like: | ||
| + | |||
| + | [[Image:2013-09-23-Azz-cent.png|400px]] | ||
| + | |||
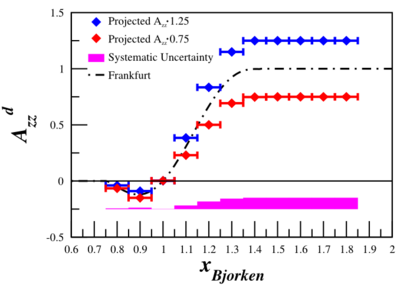
| + | If we split it into Azz*1.25 and Azz*0.75, we can get a sense of how well we can separate models: | ||
| + | |||
| + | [[Image:2013-09-23-Azz-split.png|400px]] | ||
| + | |||
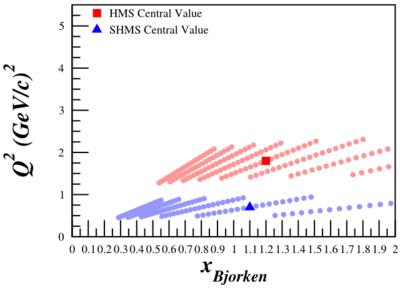
| + | And the Q2 range looks like: | ||
| + | |||
| + | [[Image:2013-09-23-q2-range.png|400px]] | ||
| + | |||
| + | |||
| + | --[[User:Ellie|E. Long]] 15:52, 23 September 2013 (UTC) | ||
Latest revision as of 10:59, 23 September 2013
W Scan and Rates
Rates Issue
There was a minor rates issue that occurred, not in the statistics, but in the maximum rate for past plots. They're all of the correct order of magnitude, but off by about 10% or so. It was causing the rates in the Rates plot (which was separated from the statistical uncertainty, which was correct) to come out slightly higher than they should have been. This has been corrected.
W Scan
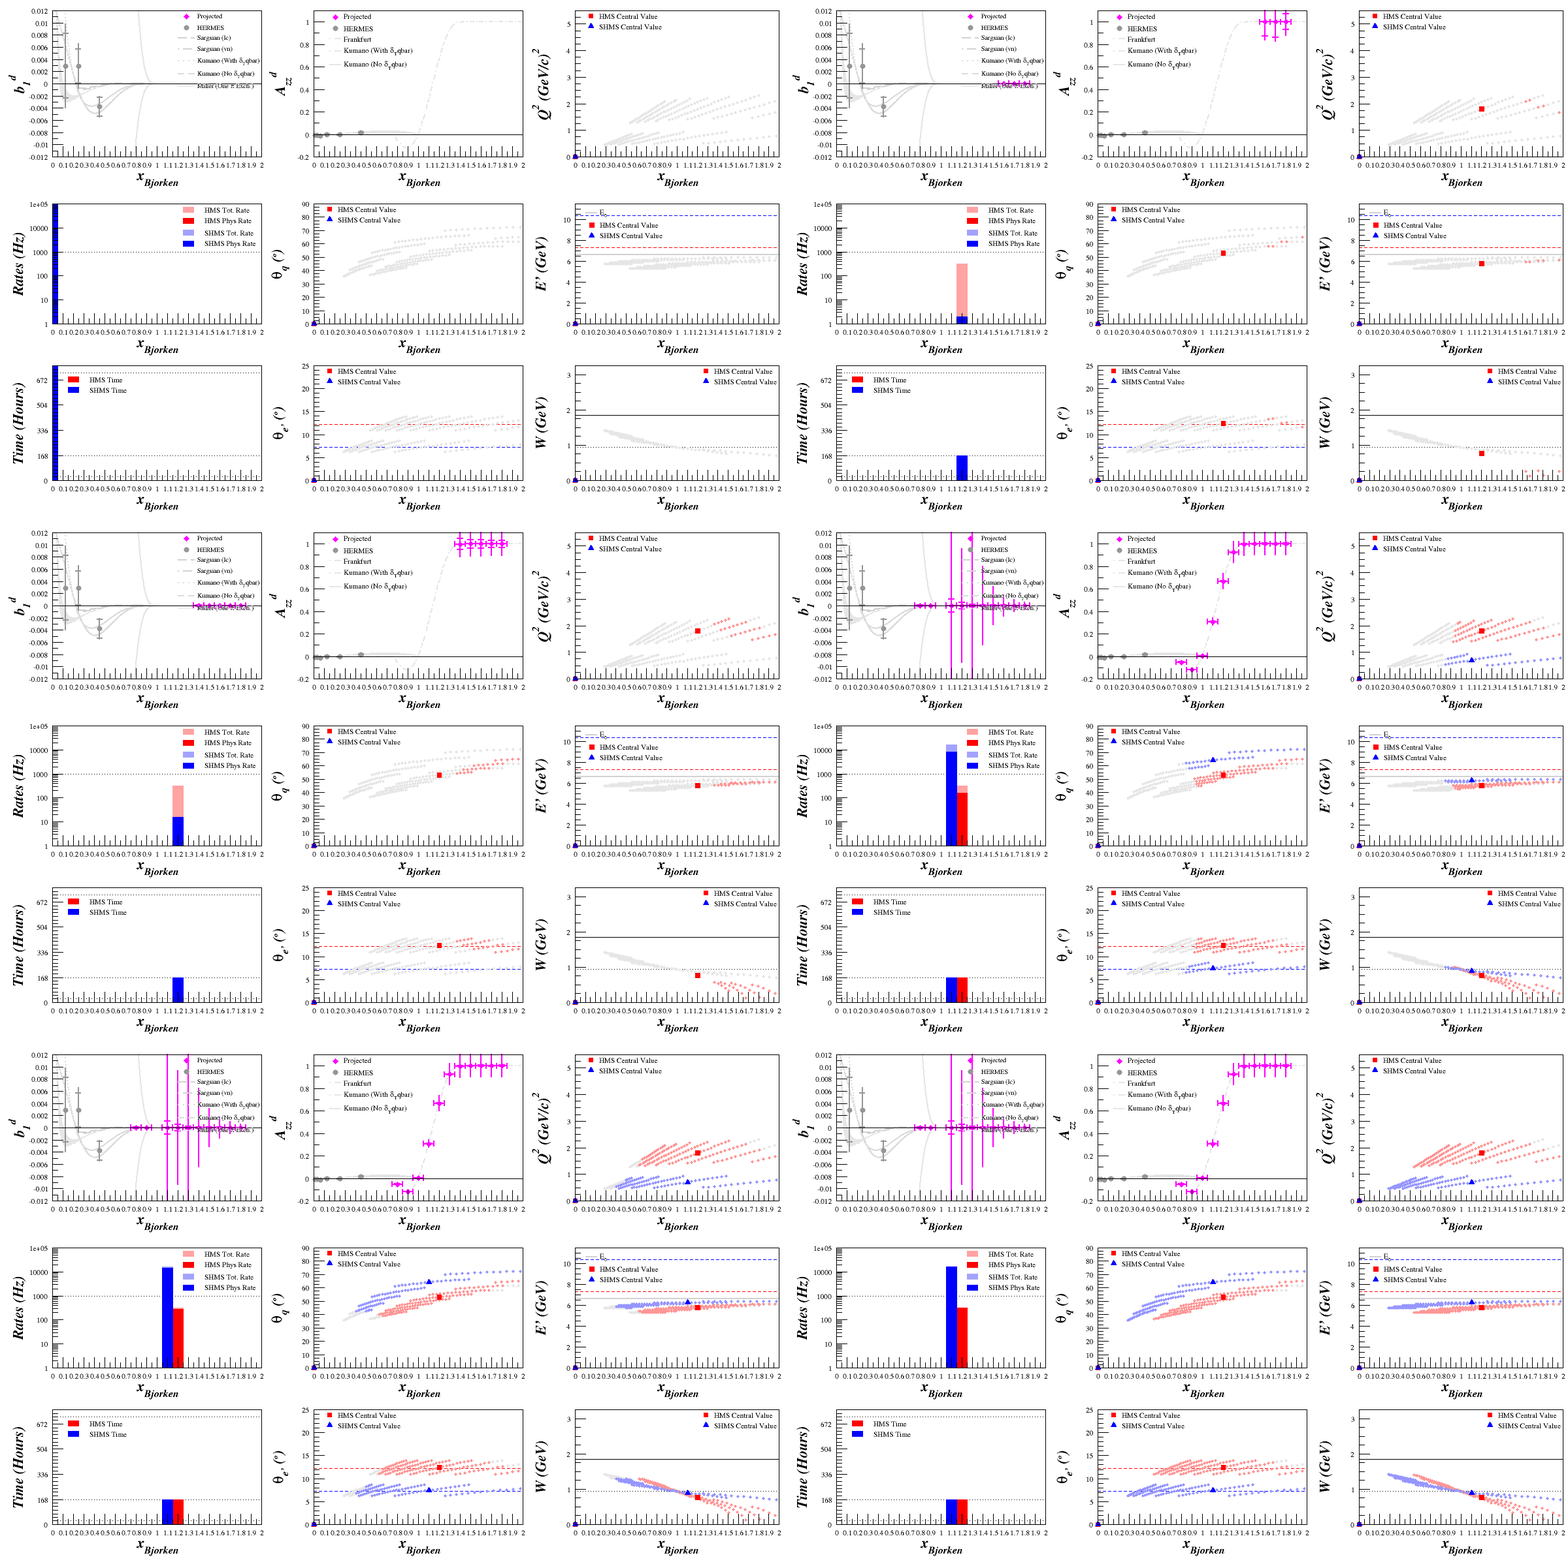
Using incoming beam energy of 6.6 GeV and the optimized from earlier today, I did a scan over W to see how it affects the rates. The lighter colors are the total rates and the darker color (smaller rates) are with a W cut that starts at W<0 and increases to W<1.5
This gives us an indication of the contribution from:
DIS:
Quasi-Elastic:
and SRC:
Possible Measurement
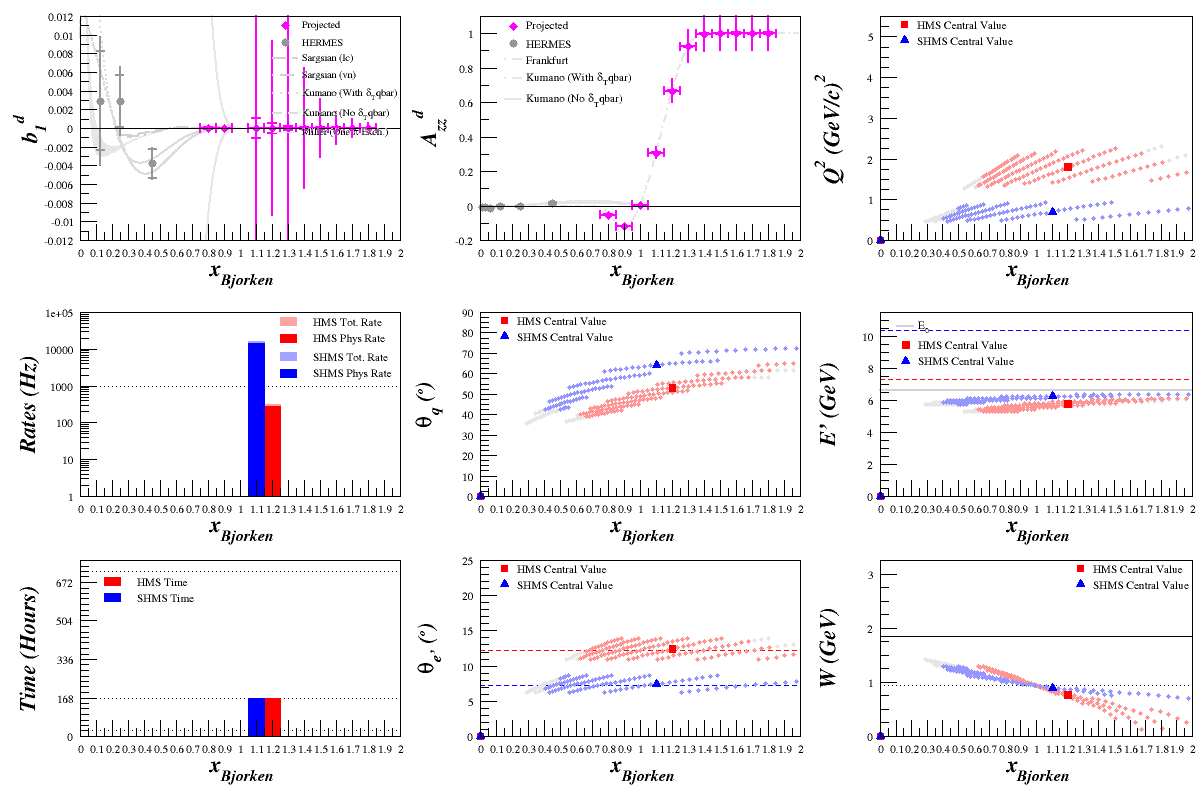
With one week of data and a 6.6 GeV beam, with the HMS at E'=5.80 GeV and 12.45 degrees (Q2=2.45, x_cent=1.20) and the SHMS at E'=6.26 GeV and 7.46 degrees (Q2=1.13, x_cent=1.10), we can obtain a measurement that looks like:
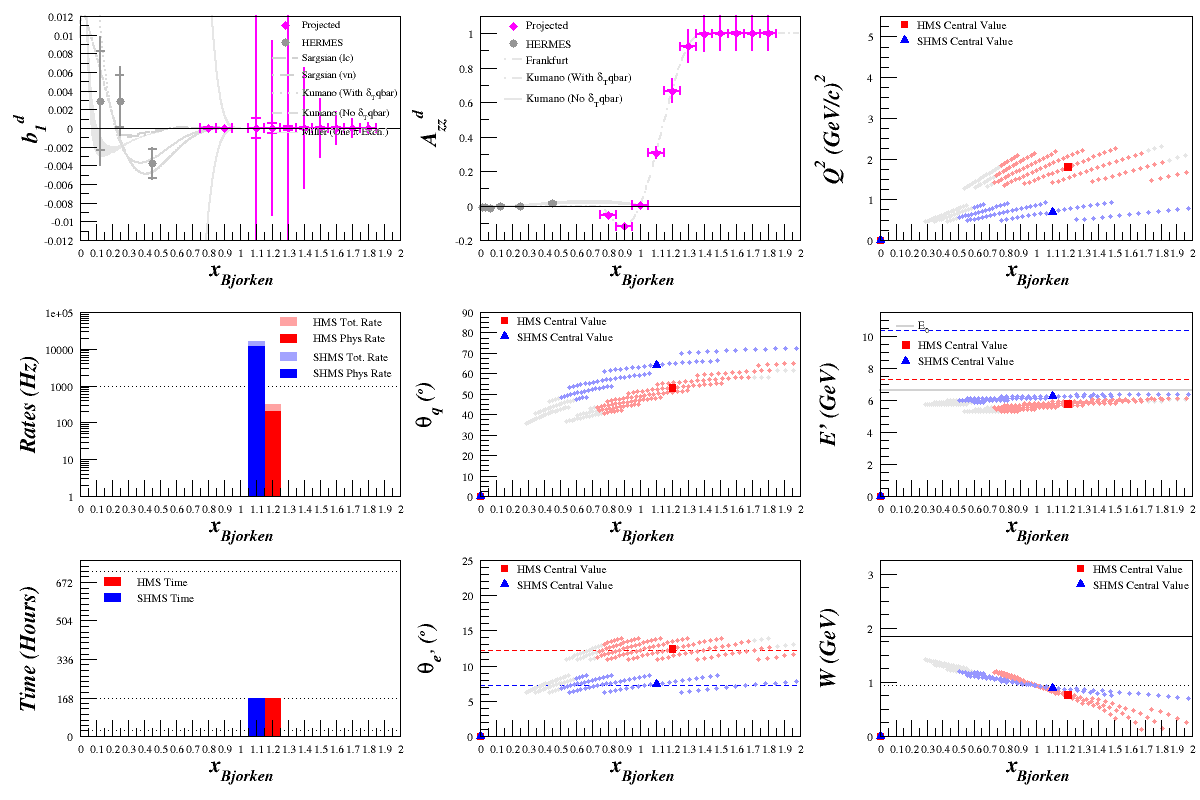
If we split it into Azz*1.25 and Azz*0.75, we can get a sense of how well we can separate models:
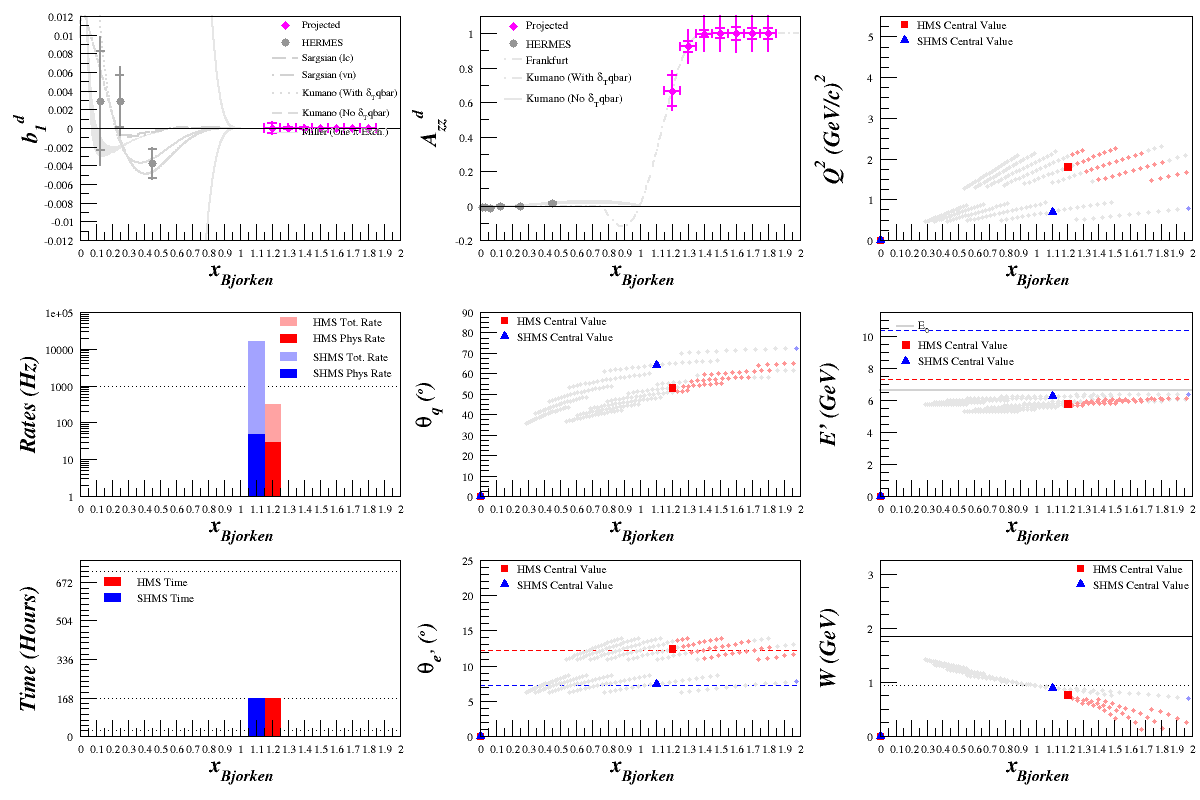
And the Q2 range looks like:
--E. Long 15:52, 23 September 2013 (UTC)
