Difference between revisions of "Elong-13-05-31"
| Line 14: | Line 14: | ||
[[Image: 2013-05-31-sys-example2.png]] | [[Image: 2013-05-31-sys-example2.png]] | ||
| + | |||
| + | --[[User:Ellie|E. Long]] 21:20, 31 May 2013 (UTC) | ||
Latest revision as of 16:20, 31 May 2013
Optimizing Systematic Uncertainty
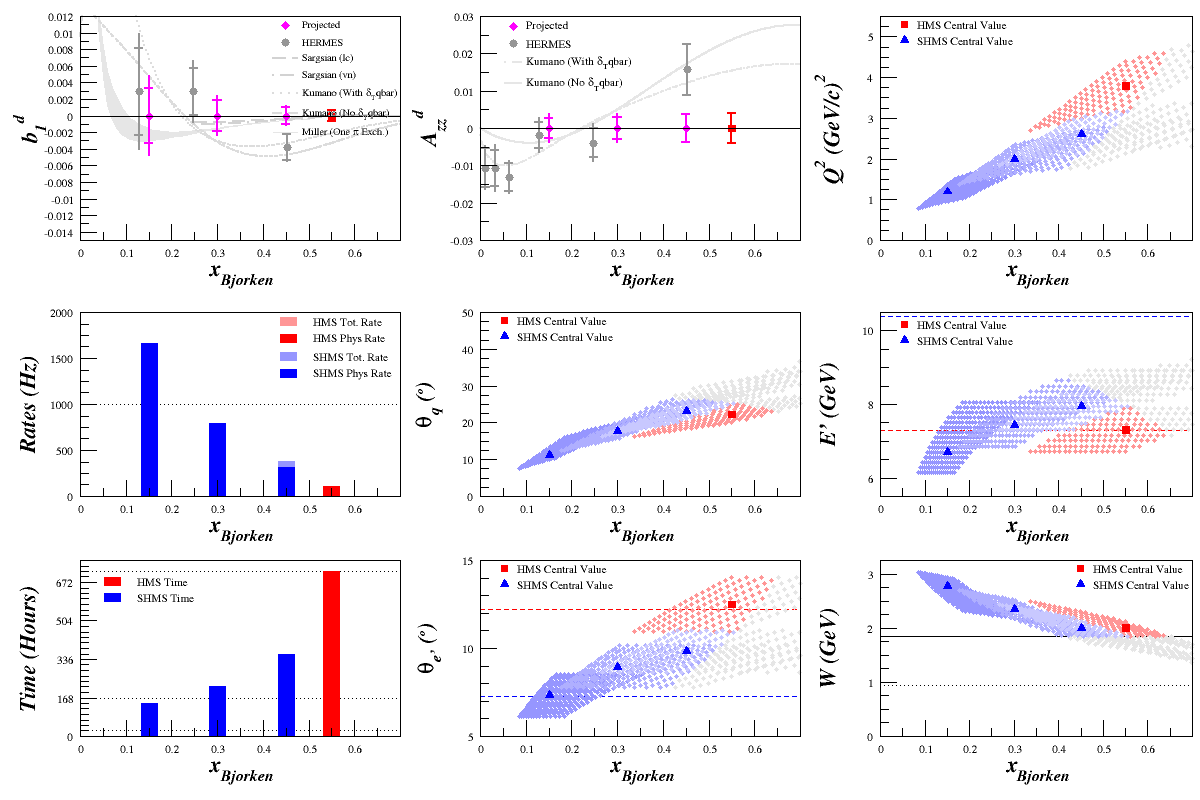
I've played around with Oscar's optimizer a little bit. Here is the original and here is my updated version. There are a few things I changed and added, since how we're handling the addition of systematic bars is a bit trickier with the recombined bins. In Oscar's original file, he was looking at the spectrometer central x values but using the statistical uncertainties from the recombined bins.
To help tease this back out, I've changed the statistical uncertainty to be the full x range for each spectrometer setting. This means that, if we look at the plot file below, each point on Azz represents the full acceptance of the corresponding HMS or SHMS acceptance (with a cut on W>1.85 only).
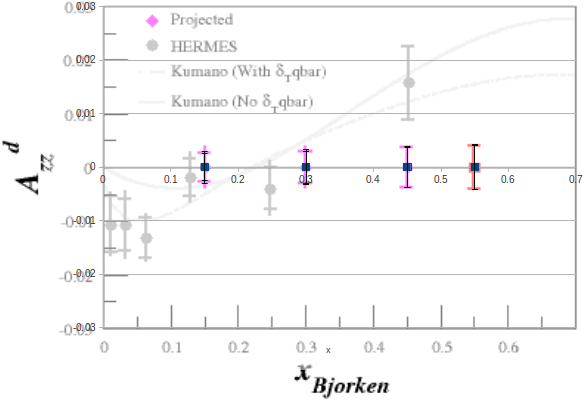
This is different than our final recombined bins in the proposal, but for the moment it can help us get a better handle on how the systematic uncertainties change. These statistical uncertainties were put into the optimizer (instead of the recombined ones). I've also included the Azz plot into the *.ods file and plotted the new values that we can play with on top of it to help visualize how the changes interact with the uncertainties, an example of which is shown below.
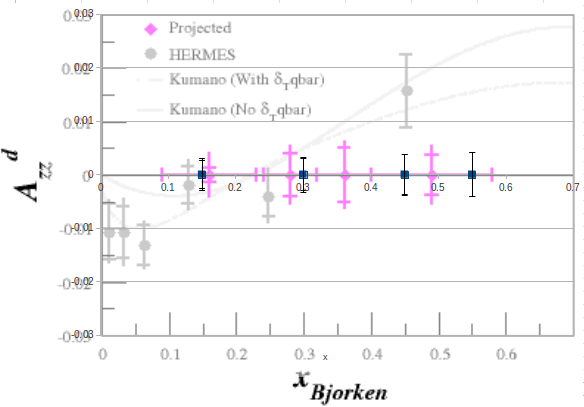
Another plot, which shows how the recombined bins compare to the individual spectrometer setting bins, was also included underneath the previous plot. I don't know if this will be terribly helpful at the moment, since it's kind of comparing apples to oranges. And example is shown below.
--E. Long 21:20, 31 May 2013 (UTC)


