Difference between revisions of "Elong-13-09-24"
From HallCWiki
Jump to navigationJump to search| Line 34: | Line 34: | ||
|} | |} | ||
| − | It's easiest to compare it to the lowest x point for b1, since that's where the rates are the closest. The b1 measurement has twice the x range and a second spectrometer setting that overlaps with it, and also a little less than half of the statistics, so I think that the uncertainties for Azz make sense. | + | It's easiest to compare it to the lowest x point for b1, since that's where the rates are the closest. The b1 measurement has twice the x range and a second spectrometer setting that overlaps with it, and also a little less than half of the statistics, and both are run on a similar time frame so I think that the uncertainties for Azz make sense. |
--[[User:Ellie|E. Long]] 17:22, 25 September 2013 (UTC) | --[[User:Ellie|E. Long]] 17:22, 25 September 2013 (UTC) | ||
Revision as of 12:46, 25 September 2013
Comparing dAzz between x<0.75 and x>0.75
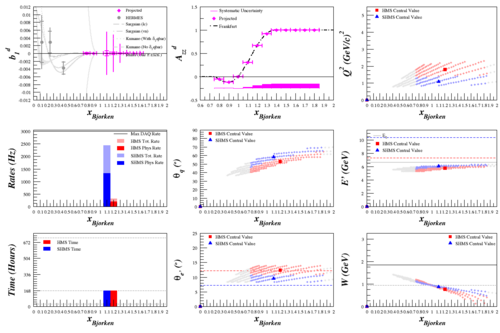
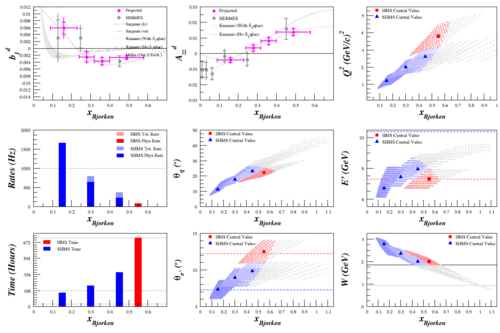
Looking at the newest Azz rates plot, that we can get those statistics from a week-long measurement almost seems too good to be true. As a check, I've compared it a bit more closely to what we did for the b1 proposal.
It's easiest to compare it to the lowest x point for b1, since that's where the rates are the closest. The b1 measurement has twice the x range and a second spectrometer setting that overlaps with it, and also a little less than half of the statistics, and both are run on a similar time frame so I think that the uncertainties for Azz make sense.
--E. Long 17:22, 25 September 2013 (UTC)

