Difference between revisions of "Elong-13-04-29"
| Line 60: | Line 60: | ||
==The db1 Problem== | ==The db1 Problem== | ||
| − | → Since ''db''<sub>1</sub> is calculated from [[Image:2013-04-24-db1d.png]], it is dependent upon ''F''<sub>1</sub> | + | → Since ''db''<sub>1</sub> is calculated from [[Image:2013-04-24-db1d.png]], it is dependent upon ''F''<sub>1</sub><br> |
| − | → For each of the <''x''> values that I've been looking at, the following show what the Bosted code produces as a function of Structure Function vs. Q^2 | + | → For each of the <''x''> values that I've been looking at, the following show what the Bosted code produces as a function of Structure Function vs. Q^2<br> |
| − | → For the plots below, the structure functions are calculated within the allowable ''Q''<sup> 2</sup> and ''W''<sup>2</sup> ranges of the Bosted fits | + | → For the plots below, the structure functions are calculated within the allowable ''Q''<sup> 2</sup> and ''W''<sup>2</sup> ranges of the Bosted fits<br> |
→ The two vertical lines indicate the ''Q''<sup> 2</sup> values where ''dA<sub>zz</sub>'' has been minimized | → The two vertical lines indicate the ''Q''<sup> 2</sup> values where ''dA<sub>zz</sub>'' has been minimized | ||
Revision as of 13:13, 26 April 2013
Rates Update
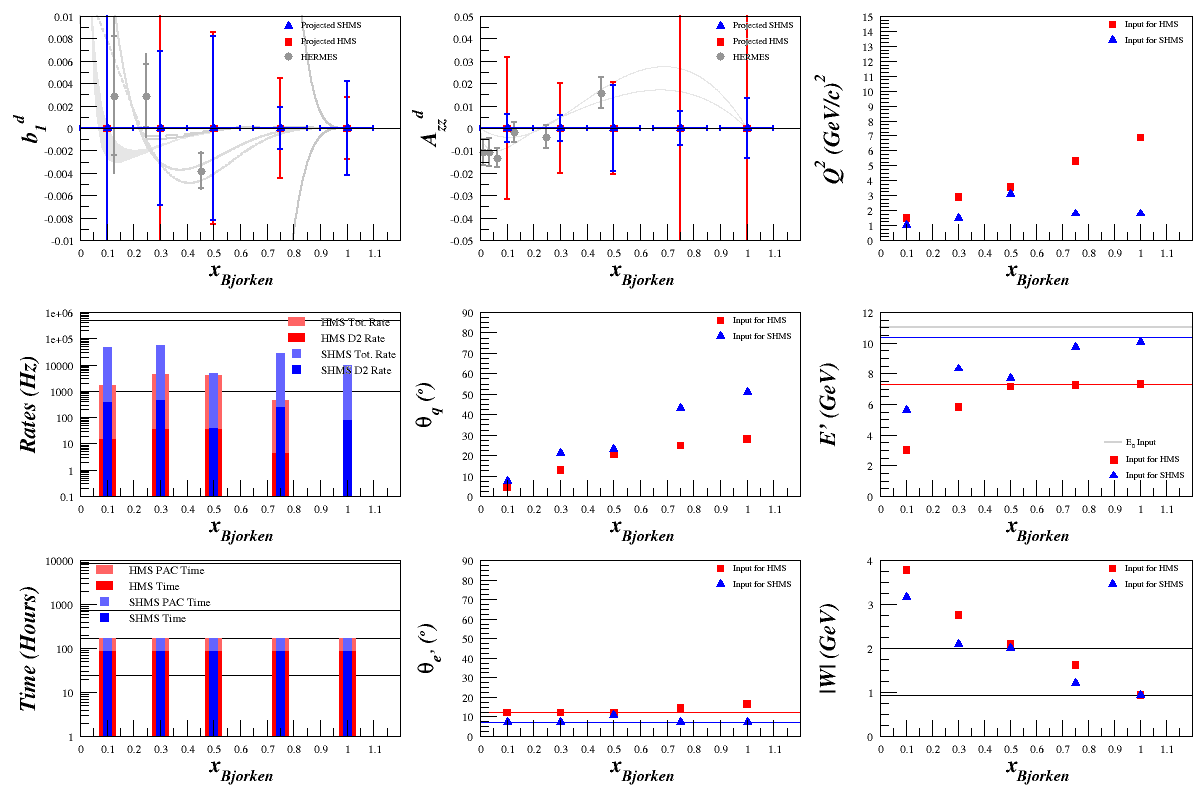
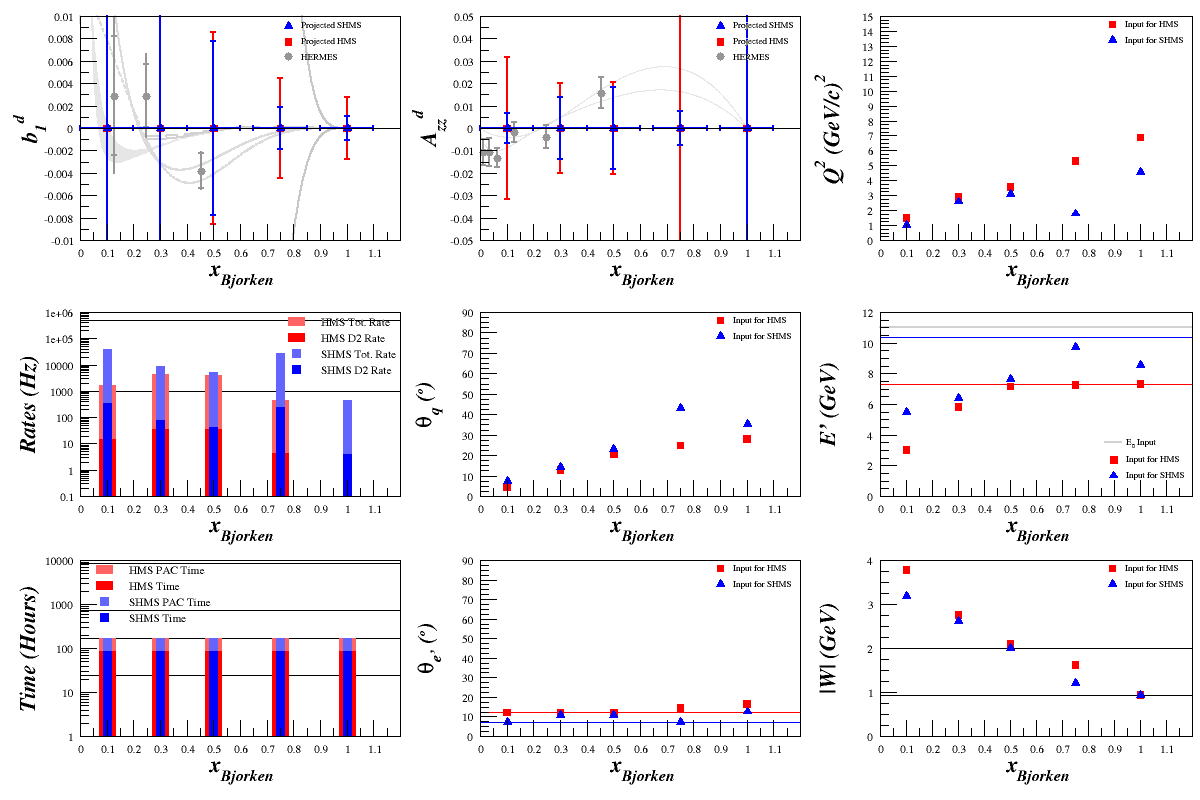
→ For the plots below, I assume the following:
Target Material ND3 Target Length 3 cm fdil 6/20 pf 0.8 Pzz 20% E0 11 GeV xBjorken 0.1, 0.3, 0.5, 0.75, 1.0 Q2 Variable θq Calculated θe' Calculated E' Calculated W Calculated
- → θe' and E' limits were added for each spectrometer
- → Error bars shown are statistical only
- → F1 and F2 are calculated using the Bosted fits, which lets us extend into a higher <x> range
- → It is valid for 0<W<3.2 GeV and 0.2<Q2<5 GeV2
- → The error bars are calculated from:
Maximizing Rate (Minimizing Azz)
If we set the spectrometer such that we aim to increase the rate as high as we can, it will get us the lowest (statistically) achievable Azz.
<x> dAzz with SHMS dAzz with HMS db1 with SHMS db1 with HMS 0.1 ??? ??? ??? ??? 0.3 ??? ??? ??? ??? 0.5 ??? ??? ??? ??? 0.75 ??? ??? ??? ??? 1.0 ??? ??? ??? ???
The db1 Problem
→ Since db1 is calculated from ![]() , it is dependent upon F1
, it is dependent upon F1
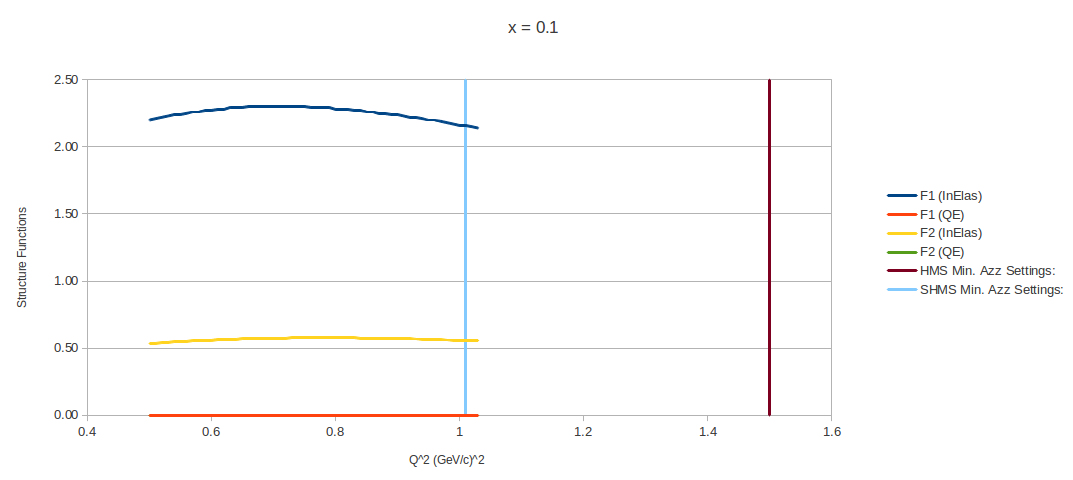
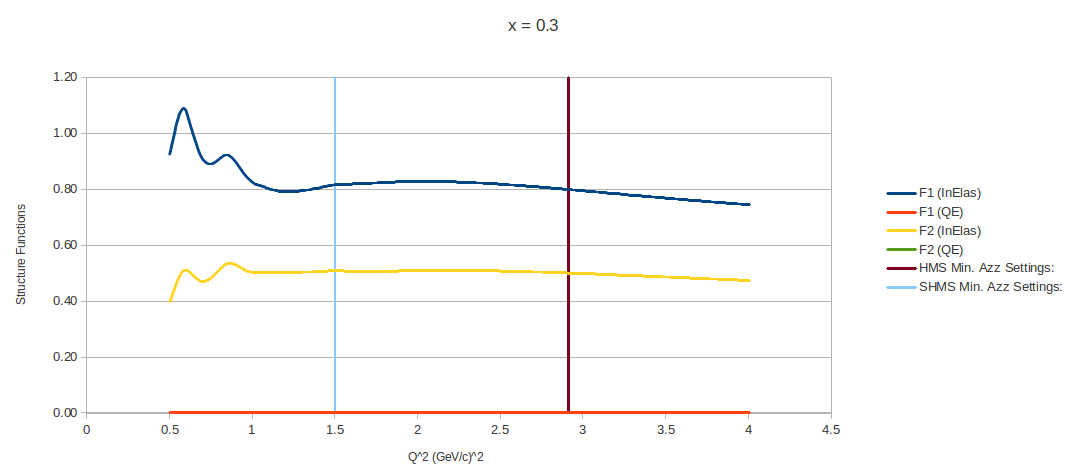
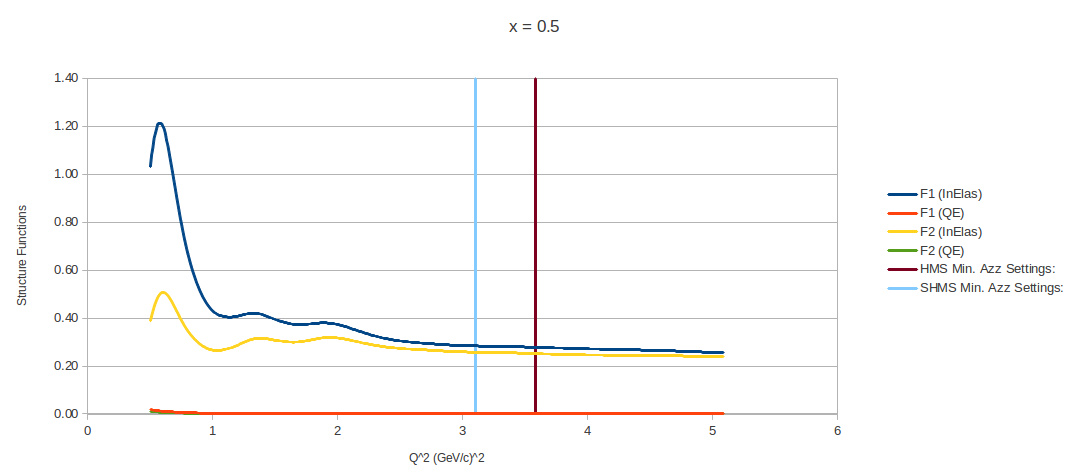
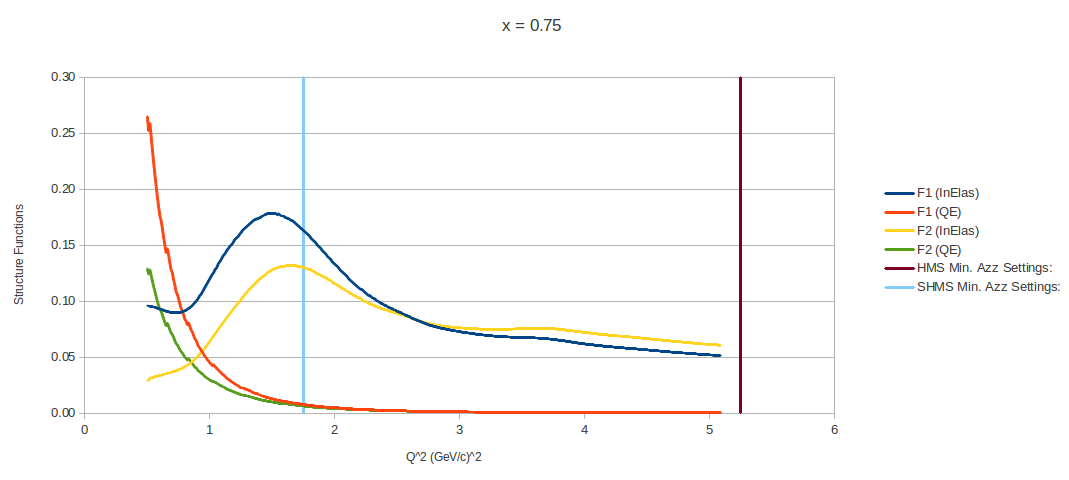
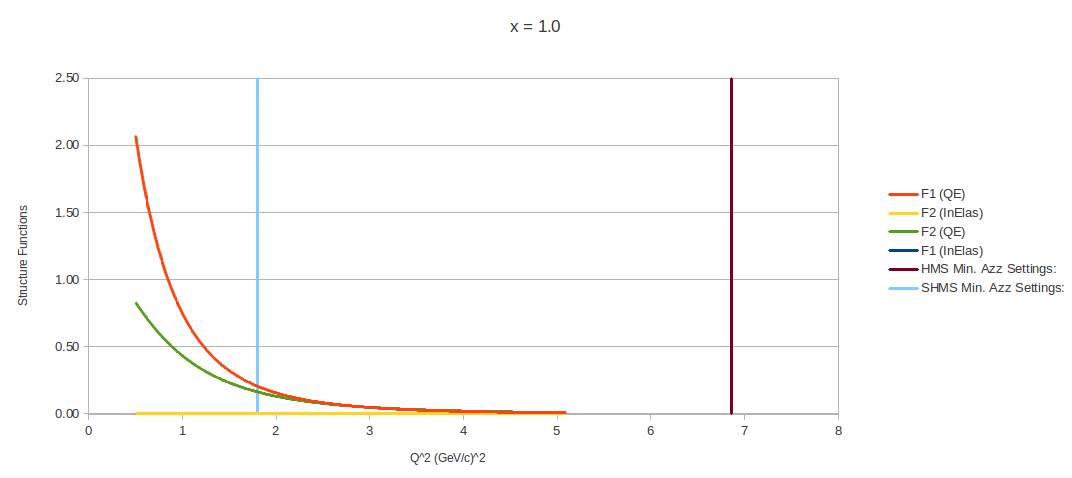
→ For each of the <x> values that I've been looking at, the following show what the Bosted code produces as a function of Structure Function vs. Q^2
→ For the plots below, the structure functions are calculated within the allowable Q 2 and W2 ranges of the Bosted fits
→ The two vertical lines indicate the Q 2 values where dAzz has been minimized
Minimizing db1
If we set the spectrometer at the lowest allowed values of F1 (from above), it will get us the lowest (statistically) achievable db1.
<x> dAzz with SHMS dAzz with HMS 0.1 ??? ??? 0.3 ??? ??? 0.5 ??? ??? 0.75 ??? ??? 1.0 ??? ???
--E. Long 17:20, 26 April 2013 (UTC)
