Difference between revisions of "Elong-13-09-24"
From HallCWiki
Jump to navigationJump to search| Line 6: | Line 6: | ||
! colspan="3" | <math>A_{zz}</math> !! !! colspan="3" | <math>b_1</math> | ! colspan="3" | <math>A_{zz}</math> !! !! colspan="3" | <math>b_1</math> | ||
|- | |- | ||
| − | | colspan="3" | [[Image:2013-09-25-Azz.png| | + | | colspan="3" | [[Image:2013-09-25-Azz.png|500px]] || || colspan="3" | [[Image:2013-09-25-b1-final.png|500px]] |
|- | |- | ||
| style="width: 50px;" | <math><x></math> || style="width: 150px;" |<math>dA_{zz}^{stat} (\times 10^{-3})</math> || style="width: 150px;" | <math>dA_{zz}^{sys} (\times 10^{-3})</math> || style="width: 5px;" | || style="width: 50px;" |<math><x></math> || style="width: 150px;" | <math>dA_{zz}^{stat} (\times 10^{-3})</math> || style="width: 150px;" | <math>dA_{zz}^{sys} (\times 10^{-3})</math> | | style="width: 50px;" | <math><x></math> || style="width: 150px;" |<math>dA_{zz}^{stat} (\times 10^{-3})</math> || style="width: 150px;" | <math>dA_{zz}^{sys} (\times 10^{-3})</math> || style="width: 5px;" | || style="width: 50px;" |<math><x></math> || style="width: 150px;" | <math>dA_{zz}^{stat} (\times 10^{-3})</math> || style="width: 150px;" | <math>dA_{zz}^{sys} (\times 10^{-3})</math> | ||
| Line 38: | Line 38: | ||
| − | --[[User:Ellie|E. Long]] | + | --[[User:Ellie|E. Long]] 17:22, 25 September 2013 (UTC) |
Revision as of 12:22, 25 September 2013
Comparing dAzz between x<0.75 and x>0.75
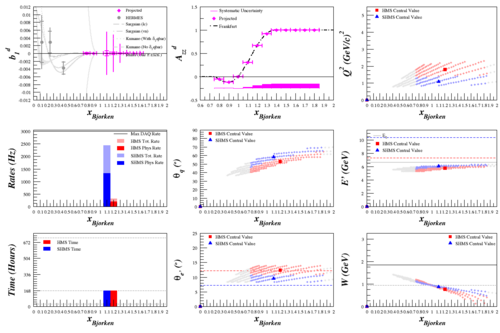
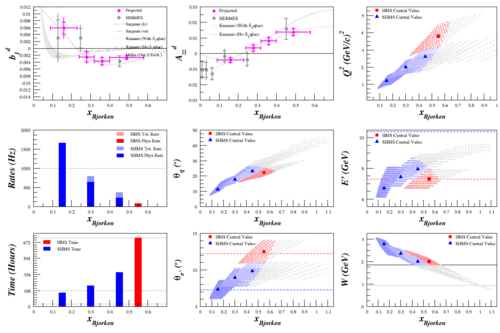
Looking at the newest Azz rates plot, that we can get those statistics from a week-long measurement almost seems too good to be true. As a check, I've compared it a bit more closely to what we did for the b1 proposal.
It's easiest to compare it to the lowest x point for b1, since that's where the rates are the closest. The b1 measurement has twice the x range, and also about half of the statistics, so I think that the uncertainties for Azz make sense.
--E. Long 17:22, 25 September 2013 (UTC)

