Difference between revisions of "Elong-13-09-27"
| Line 18: | Line 18: | ||
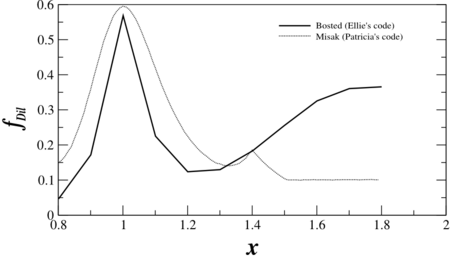
I've been using the Bosted model to extract the dilution factor, but I hadn't previously plotted it against x. This was prompted when Patricia sent me a plot that she had created as she's working with a new model from Misak. The comparison for the new Azz, using the kinematics from the SHMS, is: | I've been using the Bosted model to extract the dilution factor, but I hadn't previously plotted it against x. This was prompted when Patricia sent me a plot that she had created as she's working with a new model from Misak. The comparison for the new Azz, using the kinematics from the SHMS, is: | ||
| − | [[Image:2013-09-27-fdil-compare.png]] | + | [[Image:2013-09-27-fdil-compare.png|450px]] |
More work needs to be done to double-check the cross sections and find out why one model seems to have a much wider peak than the other. One possibility is that the Bosted (running on my code) is currently only being generated for each point that Azz is. I'll do a more intensive scan over x next week. | More work needs to be done to double-check the cross sections and find out why one model seems to have a much wider peak than the other. One possibility is that the Bosted (running on my code) is currently only being generated for each point that Azz is. I'll do a more intensive scan over x next week. | ||
--[[User:Ellie|E. Long]] 21:20, 27 September 2013 (UTC) | --[[User:Ellie|E. Long]] 21:20, 27 September 2013 (UTC) | ||
Revision as of 16:21, 27 September 2013
0.09<x<1.85 Azz Measurement
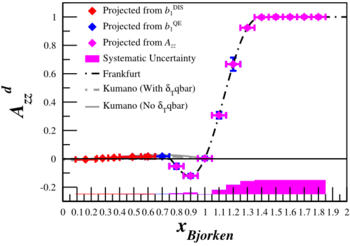
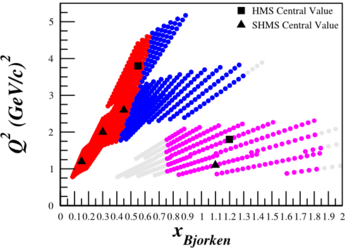
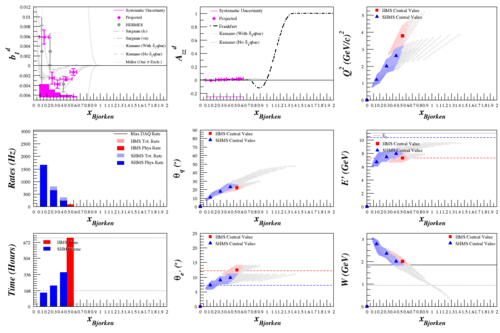
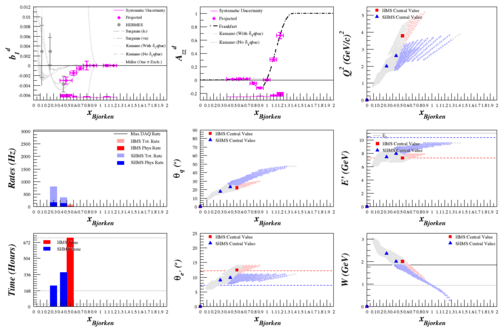
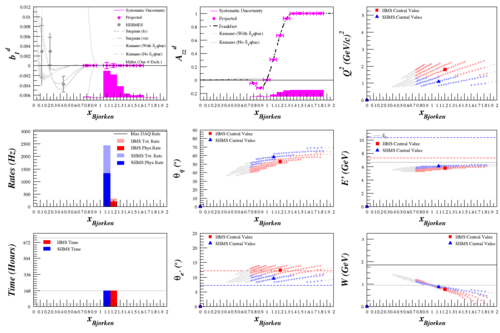
If we move forward with the new Azz measurement and combine it with the data that we'll get from b1, we'll have measurements of Azz over a large x range.
| <math>b_1^{\mathrm{DIS}}</math> | <math>b_1^{\mathrm{QE}}</math> | <math>A_{zz}</math> |
|---|---|---|
 |
 |
|
If we combine all three of these into a single plot, it shows the entire range.
Diluction Factor Comparisons
I've been using the Bosted model to extract the dilution factor, but I hadn't previously plotted it against x. This was prompted when Patricia sent me a plot that she had created as she's working with a new model from Misak. The comparison for the new Azz, using the kinematics from the SHMS, is:
More work needs to be done to double-check the cross sections and find out why one model seems to have a much wider peak than the other. One possibility is that the Bosted (running on my code) is currently only being generated for each point that Azz is. I'll do a more intensive scan over x next week.
--E. Long 21:20, 27 September 2013 (UTC)
