Difference between revisions of "Elong-13-10-04"
From HallCWiki
Jump to navigationJump to search (New page: ===Comparison Bosted and Misak Cross-sections to Data=== There are a few points of data that we can compare the Bosted and Misak cross-section code to so that we can make sure to get a go...) |
|||
| Line 8: | Line 8: | ||
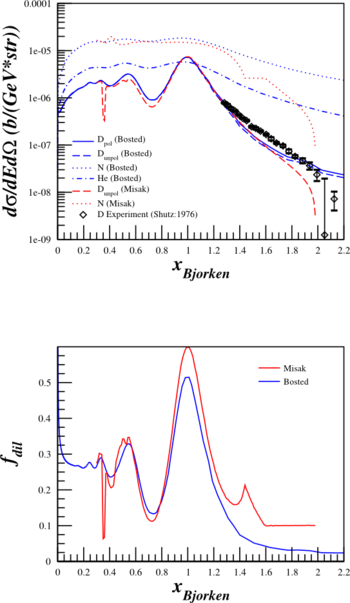
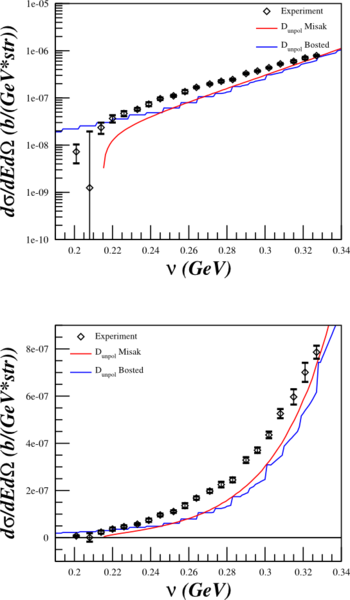
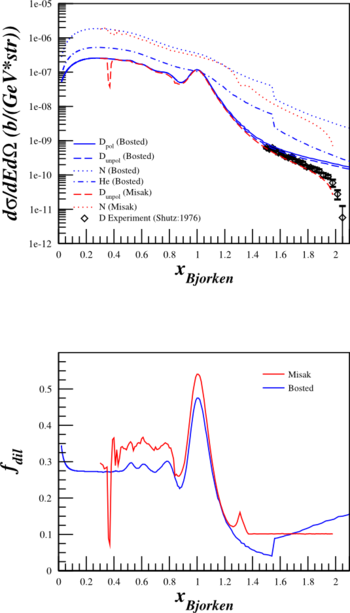
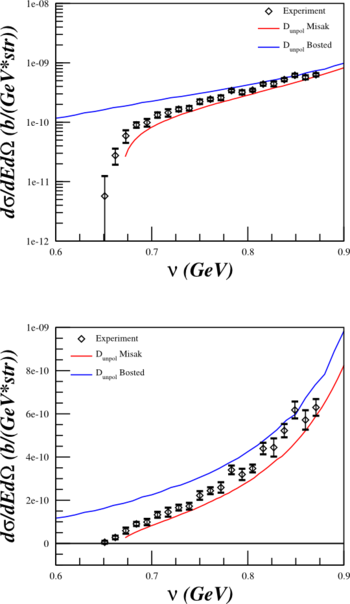
! Similar to <math>A_{zz}</math><br><math>E_{\mathrm{beam}}=6.519\mathrm{~GeV}</math><br><math>\theta_{e'}=8.00^{\circ}</math> !! Similar to <math>b_1</math><br><math>E_{\mathrm{beam}}=11.671\mathrm{~GeV}</math><br><math>\theta_{e'}=8.00^{\circ}</math> | ! Similar to <math>A_{zz}</math><br><math>E_{\mathrm{beam}}=6.519\mathrm{~GeV}</math><br><math>\theta_{e'}=8.00^{\circ}</math> !! Similar to <math>b_1</math><br><math>E_{\mathrm{beam}}=11.671\mathrm{~GeV}</math><br><math>\theta_{e'}=8.00^{\circ}</math> | ||
|- | |- | ||
| − | | [[Image:2013-10-04-Shutz-6GeV-fdil.png|350px]] | + | | [[Image:2013-10-04-Shutz-6GeV-fdil.png|350px]]<br><br>[[Image:2013-10-04-Shutz-6GeV-data.png|350px]] || [[Image:2013-10-04-Shutz-11GeV-fdil.png|350px]]<br><br>[[Image:2013-10-04-Shutz-11GeV-data.png|350px]] |
| − | | | ||
| − | | [[Image:2013-10-04-Shutz- | ||
|- | |- | ||
|} | |} | ||
The top and bottom plots are the same, just that the top are on a log scale and the bottom on a linear scale. | The top and bottom plots are the same, just that the top are on a log scale and the bottom on a linear scale. | ||
Revision as of 09:44, 4 October 2013
Comparison Bosted and Misak Cross-sections to Data
There are a few points of data that we can compare the Bosted and Misak cross-section code to so that we can make sure to get a good estimate depending on our kinematics.
Using the deuterium information from the quasi-elastic scattering archive data page, there are two measurements (both Shutz:1976) that are similar to our settings:
The top and bottom plots are the same, just that the top are on a log scale and the bottom on a linear scale.


