Difference between revisions of "Elong-13-10-10"
| Line 23: | Line 23: | ||
[[Image:2013-10-10-e-66-cs-exp3.png]] | [[Image:2013-10-10-e-66-cs-exp3.png]] | ||
| + | ===HMS<sub>min</sub>=12.2 degrees=== | ||
If it turns out that the HMS is restricted from the target to a minimum angle of 12.2 degrees, then we can expect the following: | If it turns out that the HMS is restricted from the target to a minimum angle of 12.2 degrees, then we can expect the following: | ||
Revision as of 12:23, 11 October 2013
Azz with Color-Coded Plots
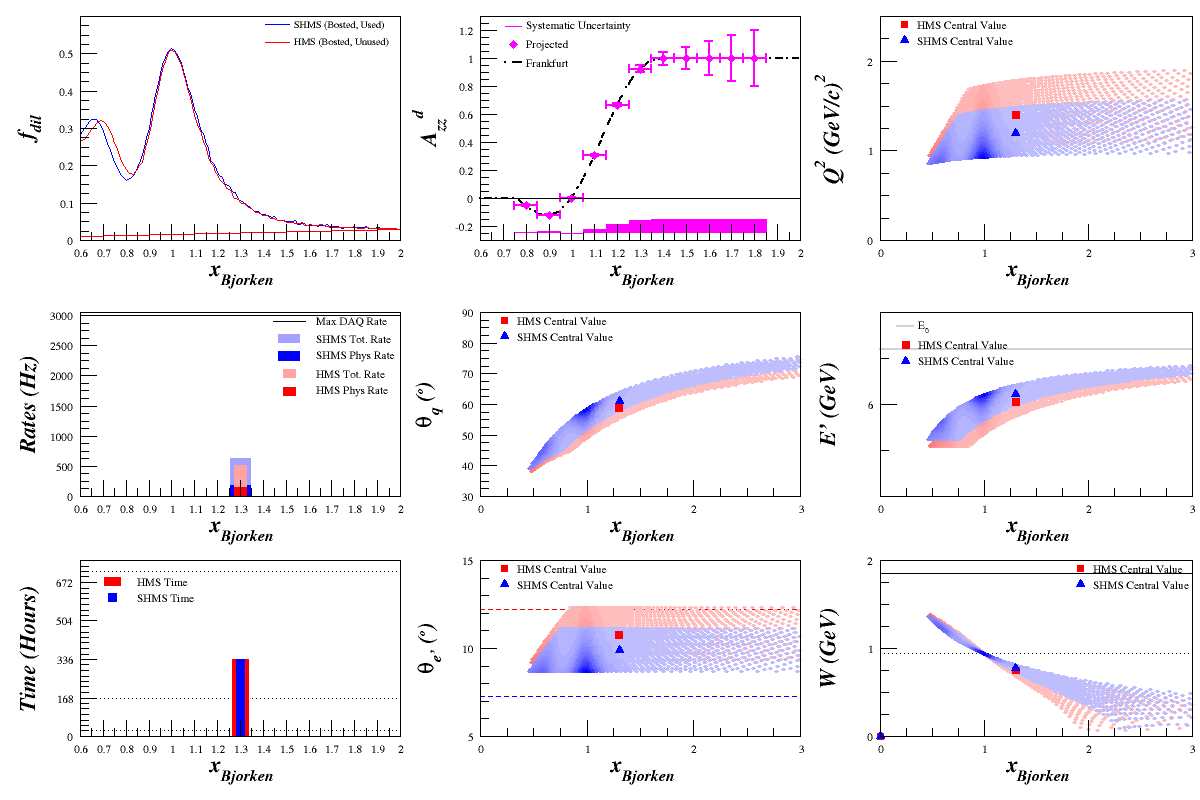
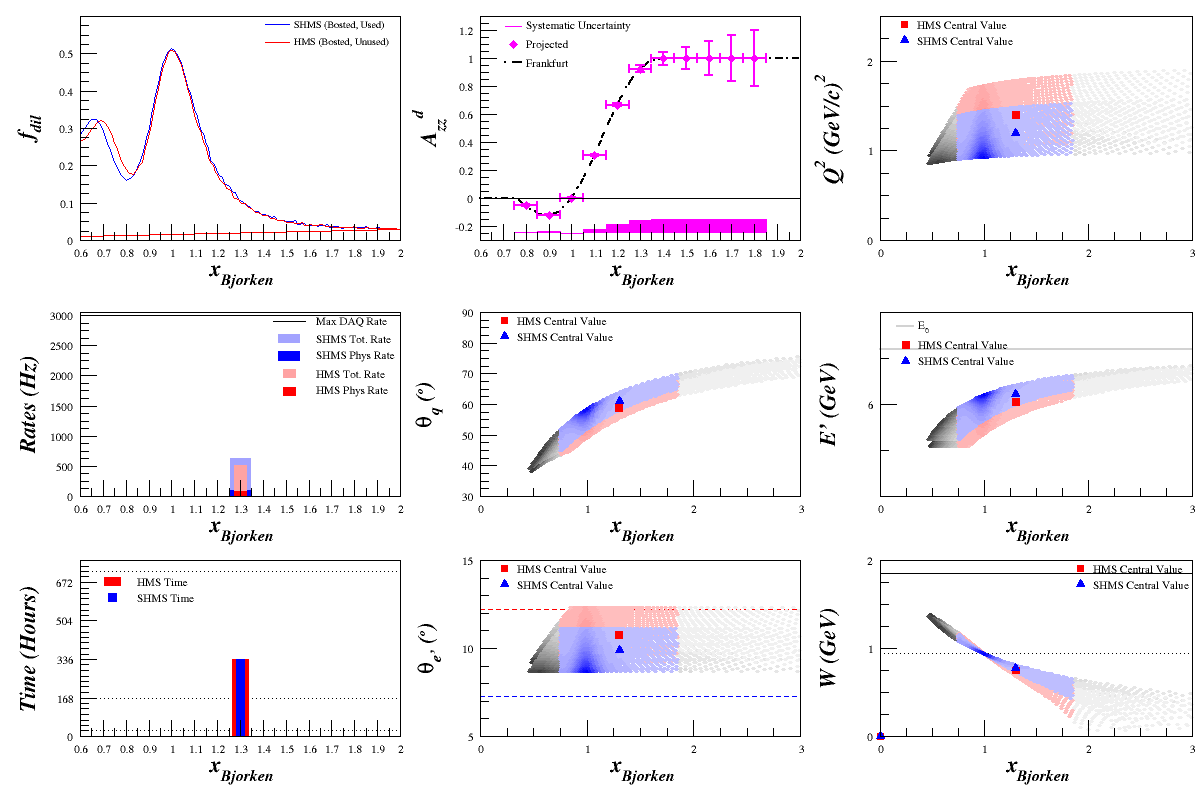
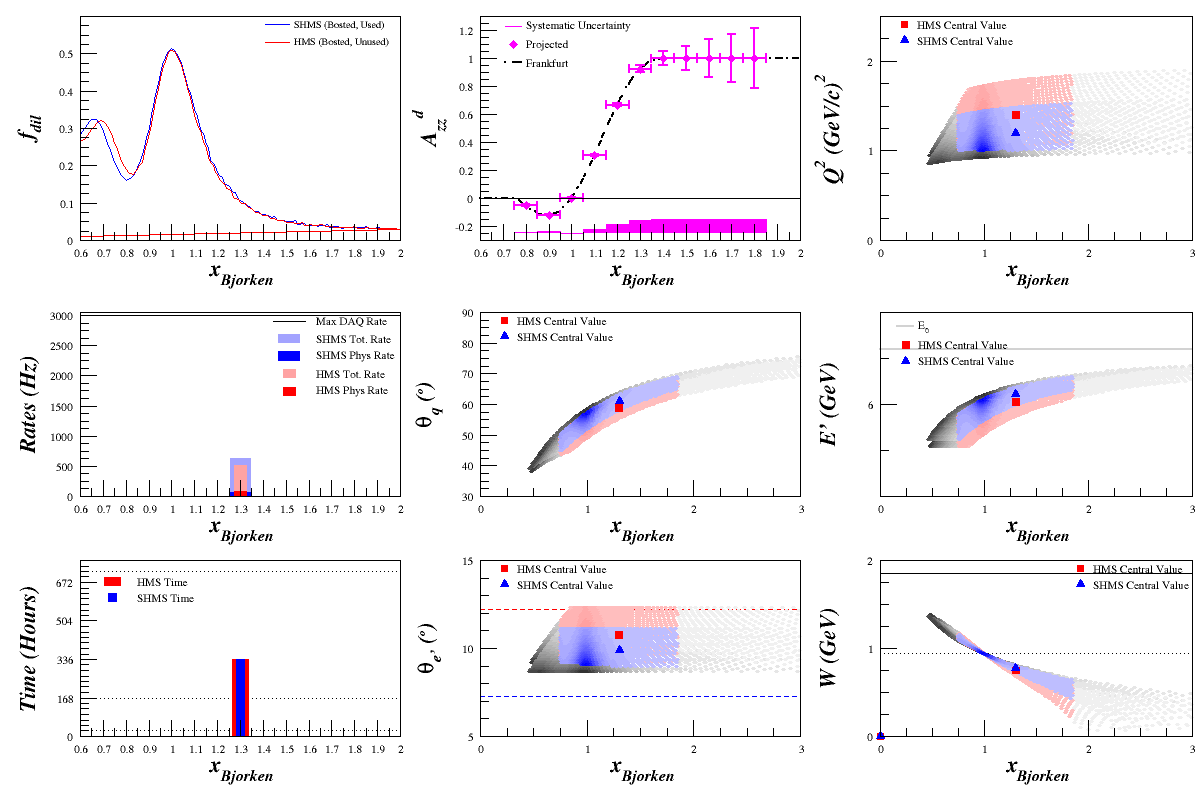
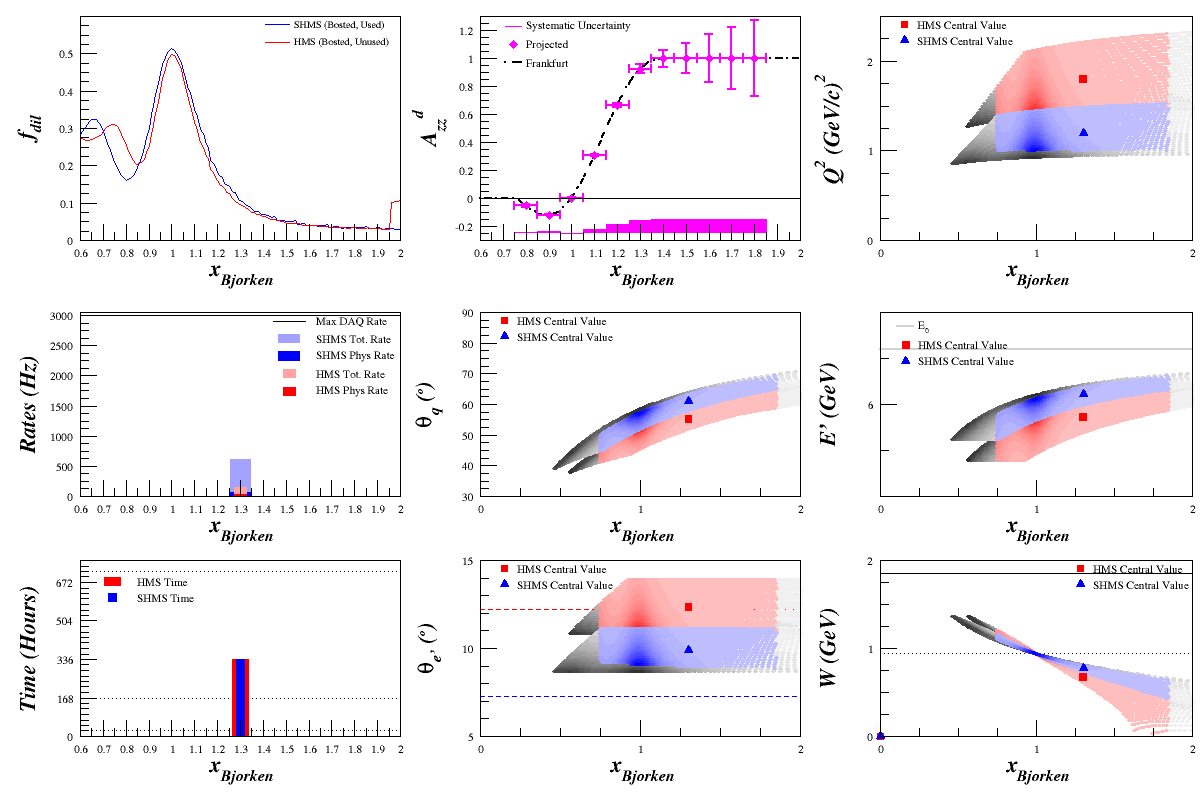
I took the edited the output of Azz plots so that they have their own, dedicated grace files. I then replaced the b1 plot with the dilution factor and shaded the kinematics plots by the total cross-section (N+He+2H), where darker = larger cross-section and lighter = smaller cross-section. The cross-sections each have 20 shading bins, with the cross section in that section being linearly scaled to fit from 1-20. This means that it's not the same scale across spectrometers, or from cuts to background, just to keep in mind. I included it to get a sense of where our data is coming from.
I also changed the "Physics Rate" to mean the rate from 2H within the kinematics cuts. Previously, it was the total rate (14N+4He+2H) within the cuts.
No Cuts
If we don't make any cuts on the kinematics, we can get a sense for the cross-section everywhere:
0.75<x<1.85 Cut
If we then add the x cut, the thrown-out events, still in grey, are now also shaded:
0.75<x<1.85 and Q^2>1 Cuts
And adding a Q2>1 cut:
HMSmin=12.2 degrees
If it turns out that the HMS is restricted from the target to a minimum angle of 12.2 degrees, then we can expect the following:
--E. Long 22:19, 10 October 2013 (UTC)


