Difference between revisions of "Elong-14-02-04"
(New page: ==G. Miller's New b1 Calculations== Reading through [http://arxiv.org/pdf/1311.4561.pdf G. Miller's paper that includes new calculations of b1 based on 6-quark, hidden color contributions...) |
|||
| Line 4: | Line 4: | ||
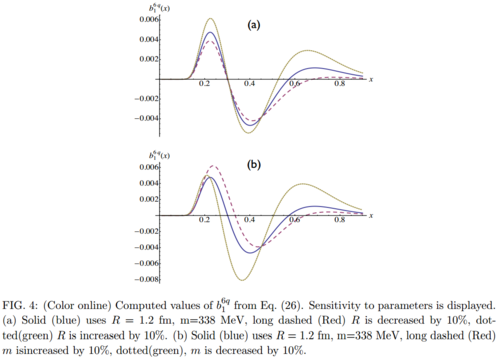
[[Image:2014-02-04-gmiller_fig4.png|500px]] | [[Image:2014-02-04-gmiller_fig4.png|500px]] | ||
| + | |||
| + | |||
| + | ===Compared to Proposal=== | ||
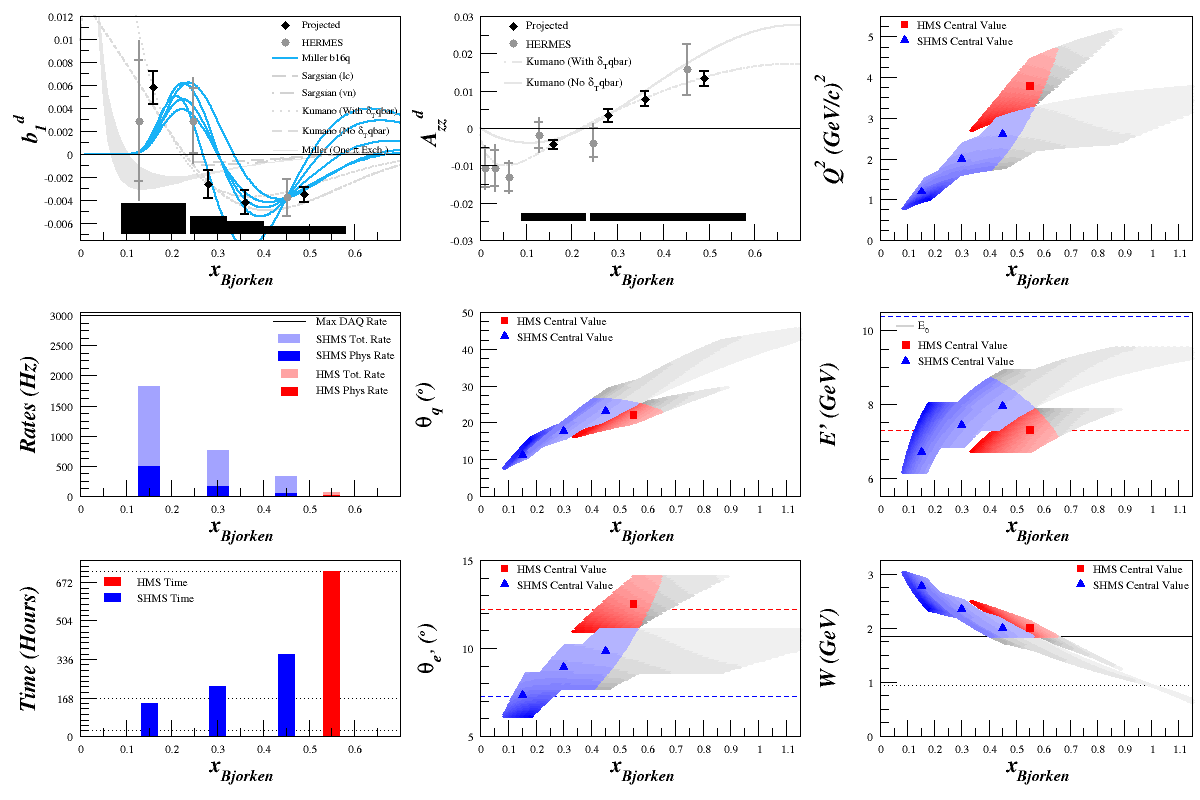
If I just add these to the plots we had on our proposal, it looks like: | If I just add these to the plots we had on our proposal, it looks like: | ||
| Line 9: | Line 12: | ||
[[Image:2014-02-04-b16q_proposal.png]] | [[Image:2014-02-04-b16q_proposal.png]] | ||
| + | |||
| + | ===W > 1.5=== | ||
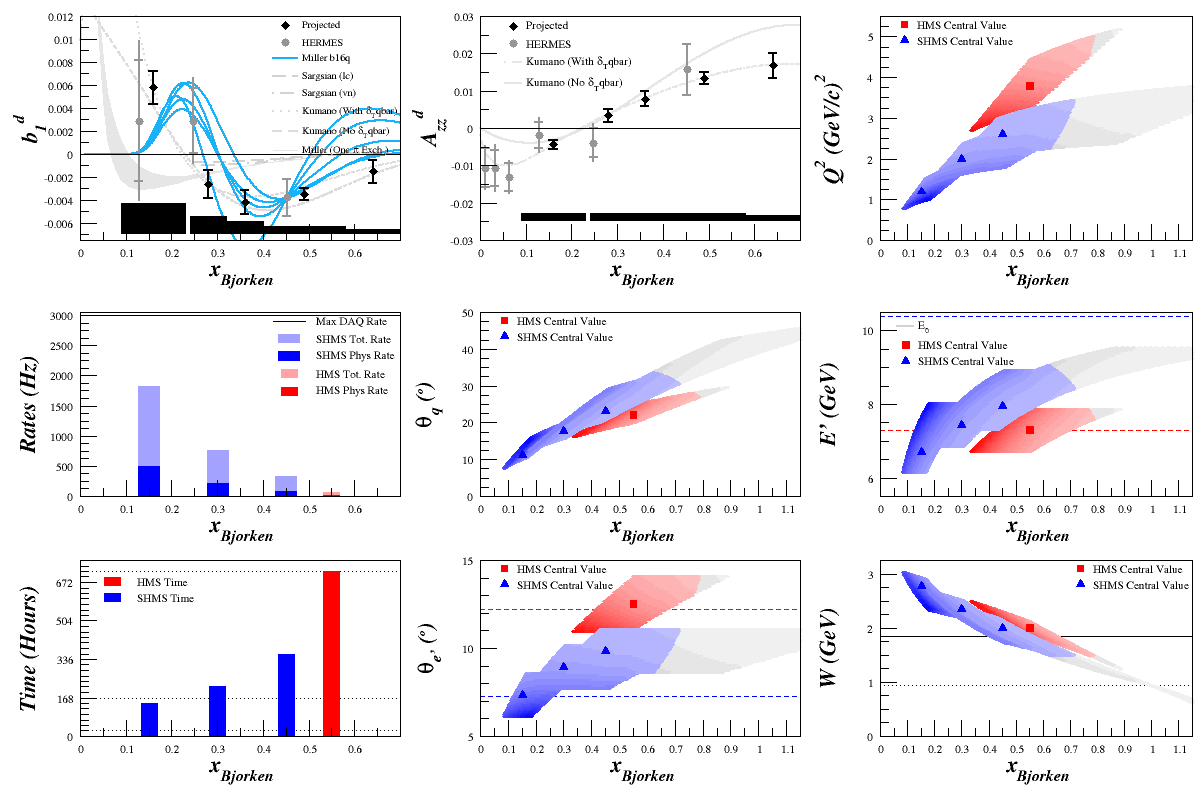
It looked like if we could squeeze another point out around 0.65, then there might be a chance to further constrain the model. However, this would require dropping our W cut from 1.85 to 1.50. The result would be: | It looked like if we could squeeze another point out around 0.65, then there might be a chance to further constrain the model. However, this would require dropping our W cut from 1.85 to 1.50. The result would be: | ||
[[Image:2014-02-04-b16q_w_15.png]] | [[Image:2014-02-04-b16q_w_15.png]] | ||
| + | |||
| + | |||
| + | ===Results=== | ||
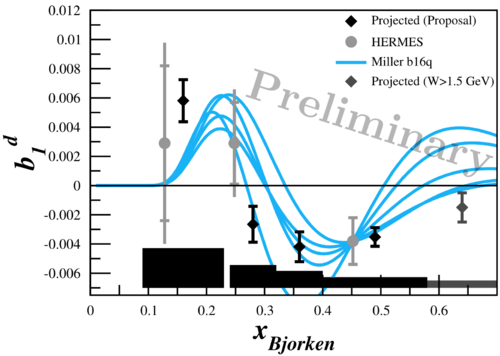
Finally, there's a lot going on in all of these plots. It we make the proposal W cut for the first 4 points, but lower it to add the 5th point, our ability to differentiate between the curves looks like: | Finally, there's a lot going on in all of these plots. It we make the proposal W cut for the first 4 points, but lower it to add the 5th point, our ability to differentiate between the curves looks like: | ||
| − | [[Image:2014-02-04-b16q_clean.png]] | + | [[Image:2014-02-04-b16q_clean.png|500px]] |
| + | |||
| + | (Note that the projected points are still shown as if they're expected along the Kumano fit) | ||
Revision as of 17:02, 4 February 2014
G. Miller's New b1 Calculations
Reading through G. Miller's paper that includes new calculations of b1 based on 6-quark, hidden color contributions, I thought I'd add his Fig. 4 plots to our proposal plot to see if we could potentially differentiate between the curves. It should be noted that this is only the 6-quark part, and doesn't include the 1-pion exchange. Because of this, these plots shouldn't be trusted below x~0.2.
Compared to Proposal
If I just add these to the plots we had on our proposal, it looks like:
W > 1.5
It looked like if we could squeeze another point out around 0.65, then there might be a chance to further constrain the model. However, this would require dropping our W cut from 1.85 to 1.50. The result would be:
Results
Finally, there's a lot going on in all of these plots. It we make the proposal W cut for the first 4 points, but lower it to add the 5th point, our ability to differentiate between the curves looks like:
(Note that the projected points are still shown as if they're expected along the Kumano fit)


