Elong-13-06-03
Including Drift by Bin
Dustin's work on the drift has given a different value depending on the spectrometer setting, which are shown in the table below.
<math>x_{\mathrm{Spectrometer}}</math> <math>dA_{zz}^{drift}</math> 0.15 0.0046 0.30 0.0037 0.45 0.0028 0.55 0.0021
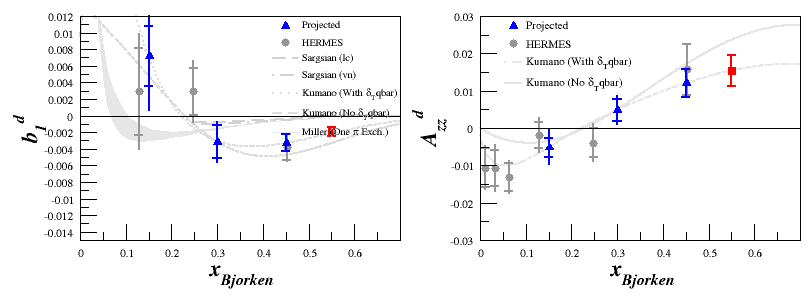
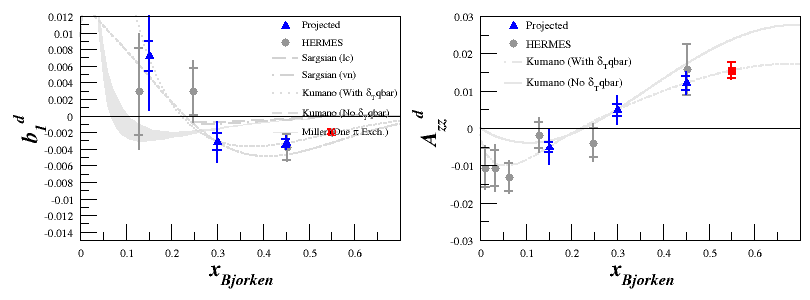
For the plots using the spectrometer settings as bins, where <math>A_{zz}</math> and <math>b_1</math> are in blue and red, these are included as an additional systematic uncertainty.
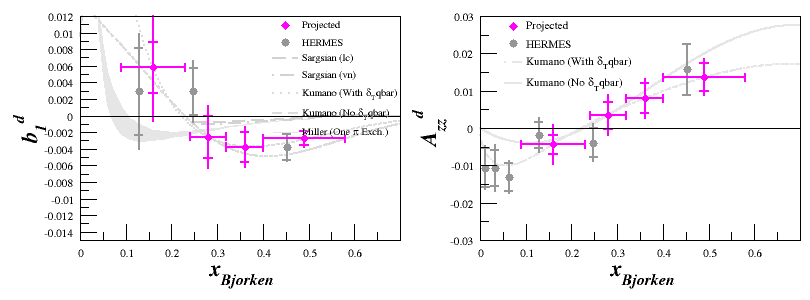
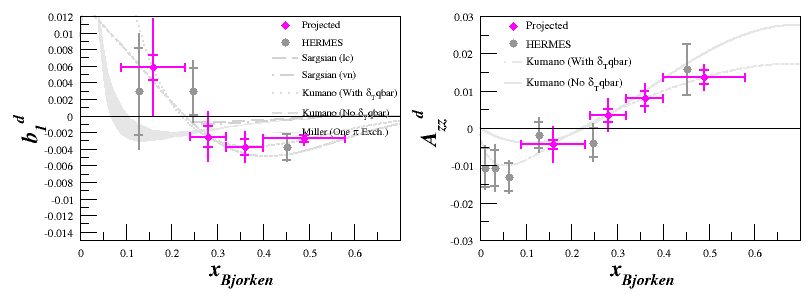
For the rebinned plots, where <math>A_{zz}</math> and <math>b_1</math> are in pink, each of the drift uncertainties are added as a weighted average. The weights are the number of events that each spectrometer contributes to the rebinned statistics.
That's to say,
<math>dA_{zz}^{Ave. Drift} = \frac{\sum \left( dA_{zz}^{drift}N_{Spec} \right)}{N_{Total}}</math>
where <math>dA_{zz}^{drift}</math> is shown in the table above for each spectrometer setting, <math>N_{Spec}</math> is the number of events from a particular spectrometer setting that go into this x bin, and <math>N_{Total}</math> is the total number of events, from all spectrometer settings, that go into this x bin.
Conservative Estimates
If we apply these with a conservative estimate, with <math>P_{zz}=20\%</math> and <math>dA_{zz}^{(Rel. Sys)} = 12\%</math>, we can estimate both the full spectrometer bins:
We can then use a weighted average for <math>dA_{zz}^{drift}</math>, where the weights are number of events that each spectrometer setting contributes to a particular <math>x</math> bin. The rebinned estimate is then:
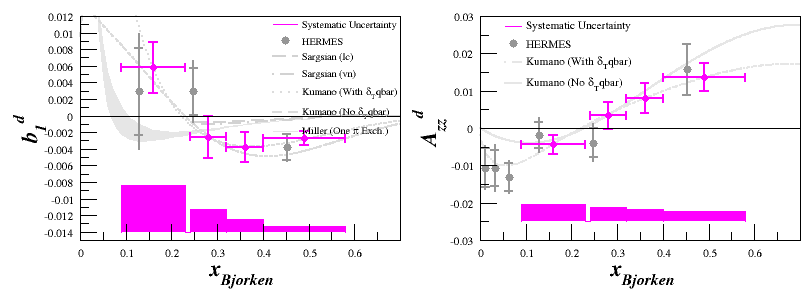
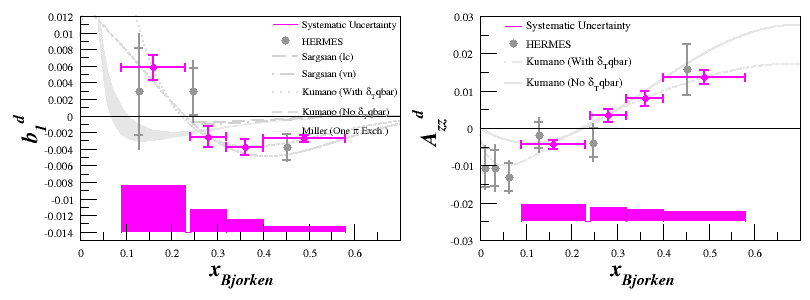
Same as above, but if we split the systematic uncertainty into bars, we get:
Optimistic Estimates
If we apply these with an optimistic estimate, with <math>P_{zz}=40\%</math> and <math>dA_{zz}^{(Rel. Sys)} = 6\%</math>, we can estimate both the full spectrometer bins:
We can then use a weighted average for <math>dA_{zz}^{drift}</math>, where the weights are number of events that each spectrometer setting contributes to a particular <math>x</math> bin. The rebinned estimate is then:
Same as above, but if we split the systematic uncertainty into bars, we get:
--E. Long 20:58, 3 June 2013 (UTC)
