Elong-13-09-30
Diluction Factor Comparisons
First Pass
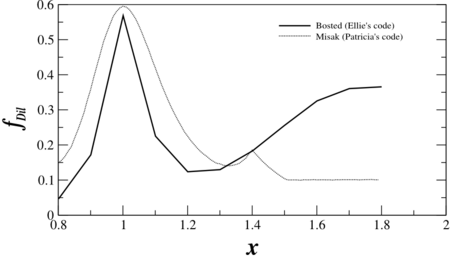
I've been using the Bosted model to extract the dilution factor, but I hadn't previously plotted it against x. This was prompted when Patricia sent me a plot that she had created as she's working with a new model from Misak. The comparison for the new Azz, using the kinematics from the SHMS, is:
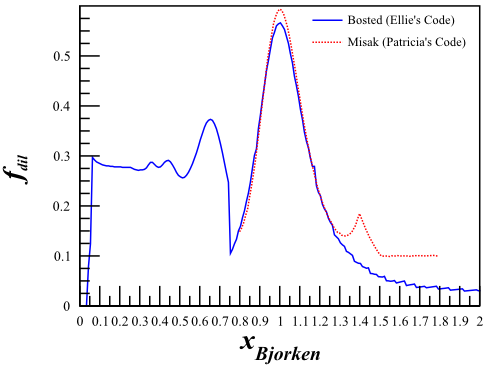
The most important difference comes in the SRC (high-x) region, where one model diverges and the other hits a plateau. More work needs to be done to double-check the cross sections and find out why one model seems to have a much wider peak than the other. One possibility is that the Bosted model (running on my code) is currently only being generated for each point that Azz is. I'll do a more intensive scan over x next week.
Larger x Range for Bosted
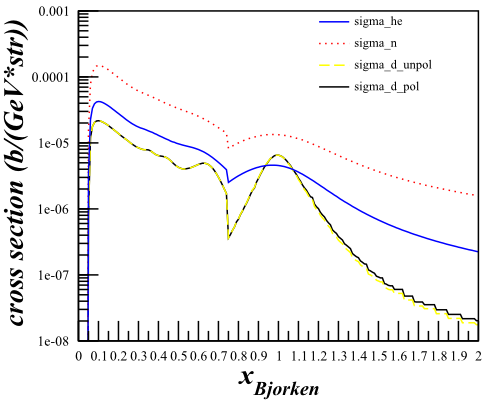
Using the kinematics for the SHMS (<math>E_{\mathrm{beam}}=6.60\mathrm{~GeV}</math>, <math>E'=6.07\mathrm{~GeV}</math>, <math>\theta_{e'}=9.51^{\circ}</math>) to calculate the cross section and scanning over <math>0<x<2</math> with 200 bins, the Bosted cross-sections come out to:
and the dilution, compared with the Misak model, comes out to:


