Elong-13-09-30
Diluction Factor Comparisons
First Pass
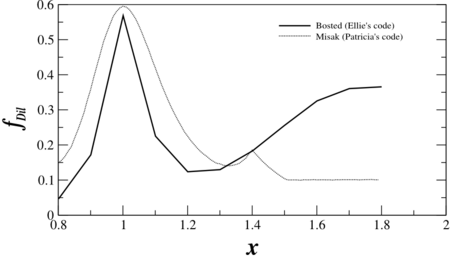
I've been using the Bosted model to extract the dilution factor, but I hadn't previously plotted it against x. This was prompted when Patricia sent me a plot that she had created as she's working with a new model from Misak. The comparison for the new Azz, using the kinematics from the SHMS, is:
(Note: The kinematics for this are the same as the SHMS's highest x point for b1, not Azz as I originally thought)
Larger x Range for Bosted
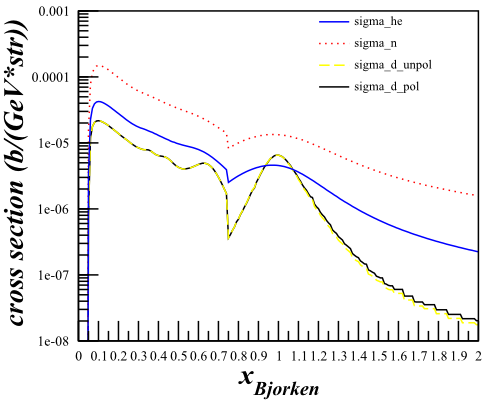
Using the kinematics for the SHMS <math>(E_{\mathrm{beam}}=6.60\mathrm{~GeV,~} E'=6.07\mathrm{~GeV,~}\theta_{e'}=9.51^{\circ})</math> to calculate the cross section and scanning over <math>0<x<2</math> with 200 bins, the Bosted cross-sections come out to:
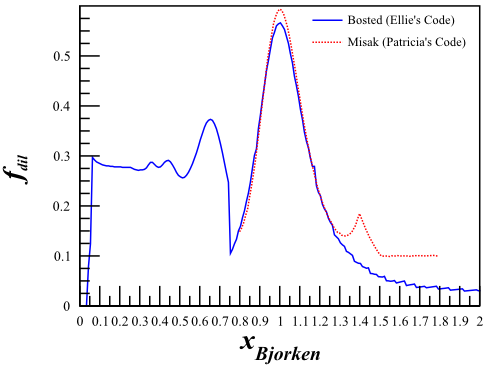
and the dilution, compared with the Misak model, comes out to:
There is a discontinuity at <math>x=0.75</math>, which is caused by a (somewhat arbitrary) switch from Bosted's DIS code to his QE code at that point. The dilution factor is also different than shown above, because in the first plot shown on this page I accidentally left the kinematics set to the b1 experiment's (and not the Azz one).
Changes to Azz Statistics
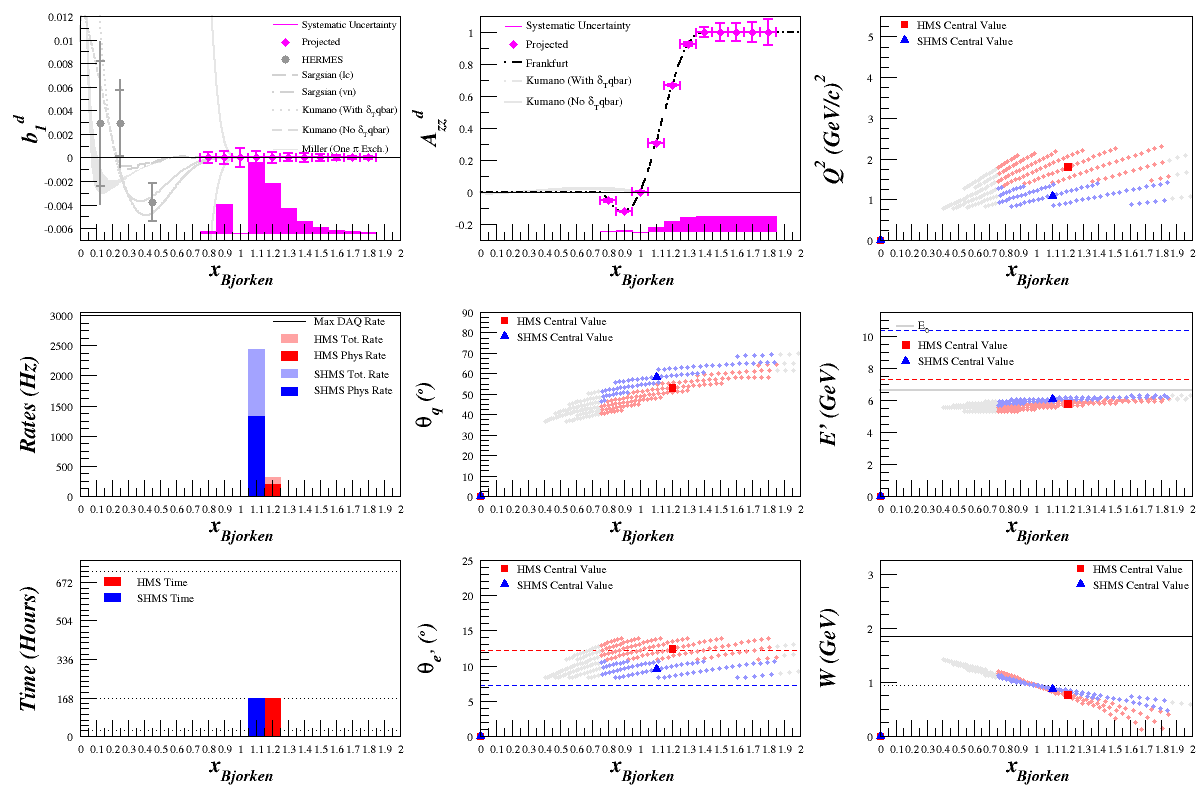
Previously, the dilution factor was assumed to be about 0.3. since this is no longer the case, and the dilution factor has been changed to that shown in the Bosted plot above, the statistics for Azz (particularly in the high-x range) get larger.


