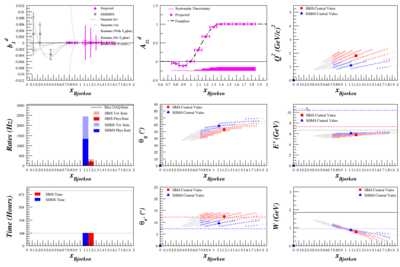
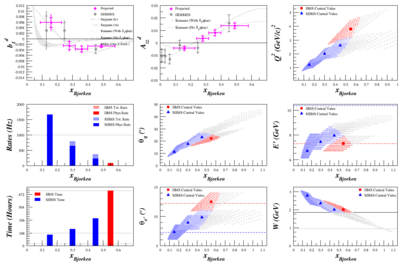
Comparing dAzz between x<0.75 and x>0.75
Looking at the newest Azz rates plot, that we can get those statistics from a week-long measurement almost seems too good to be true. As a check, I've compared it a bit more closely to what we did for the b1 proposal.
| <math>A_{zz}</math> |
|
<math>b_1</math>
|
 |
|

|
| <math><x></math> |
<math>dA_{zz}^{stat} (\times 10^{-3})</math> |
<math>dA_{zz}^{sys} (\times 10^{-3})</math> |
|
<math><x></math> |
<math>dA_{zz}^{stat} (\times 10^{-3})</math> |
<math>dA_{zz}^{sys} (\times 10^{-3})</math>
|
| 0.8 |
4.85 |
5.26 |
|
0.16 |
1.42 |
1.90
|
| 0.9 |
3.56 |
12.0 |
|
0.28 |
2.07 |
1.98
|
| 1.0 |
3.28 |
0.249 |
|
0.36 |
2.28 |
1.95
|
| 1.1 |
3.55 |
30.7 |
|
0.49 |
2.14 |
1.96
|
| 1.2 |
5.15 |
66.7
|
| 1.3 |
6.29 |
92.4
|
| 1.4 |
9.15 |
99.8
|
| 1.5 |
11.7 |
100.
|
| 1.6 |
9.26 |
100.
|
| 1.7 |
7.98 |
100.
|
| 1.8 |
9.79 |
100.
|
--E. Long 21:16, 24 September 2013 (UTC)

