Elong-14-04-15
Pzz=15% with ND3 Scenario
In a worst case scenario where we are stuck with Pzz=15% on an ND3 target, I looked into what single kinematics point we could spend all of our time on that would give us the best measurement. (Note: For each of these plots, the systematics were hard-wired to the specific kinematics we had listed for the proposal. Don't trust the systematics. The statistics are what's important.)
Individual frames for each of the plots below can be found here.
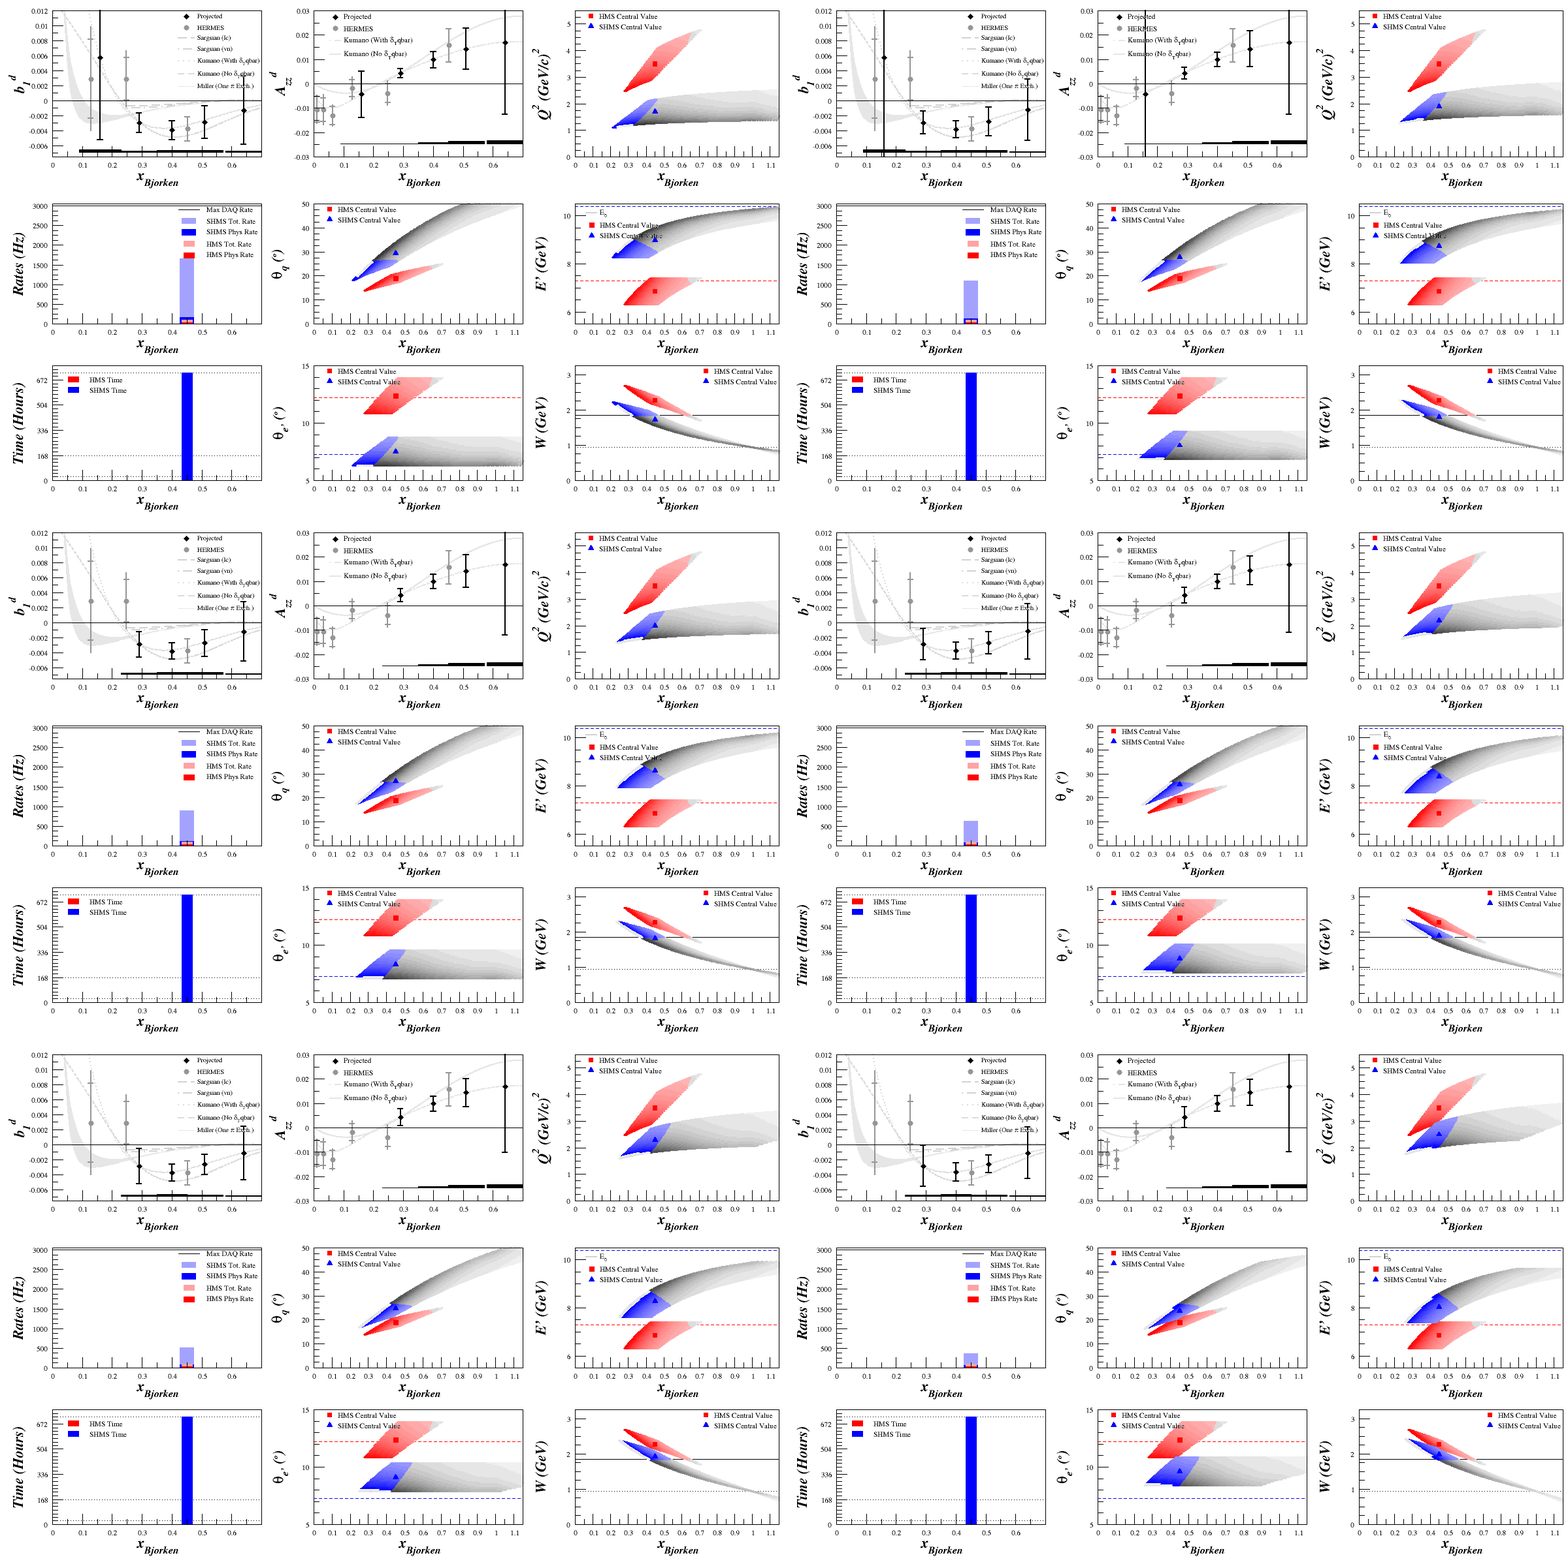
First I did a Q^2 scan of the SHMS
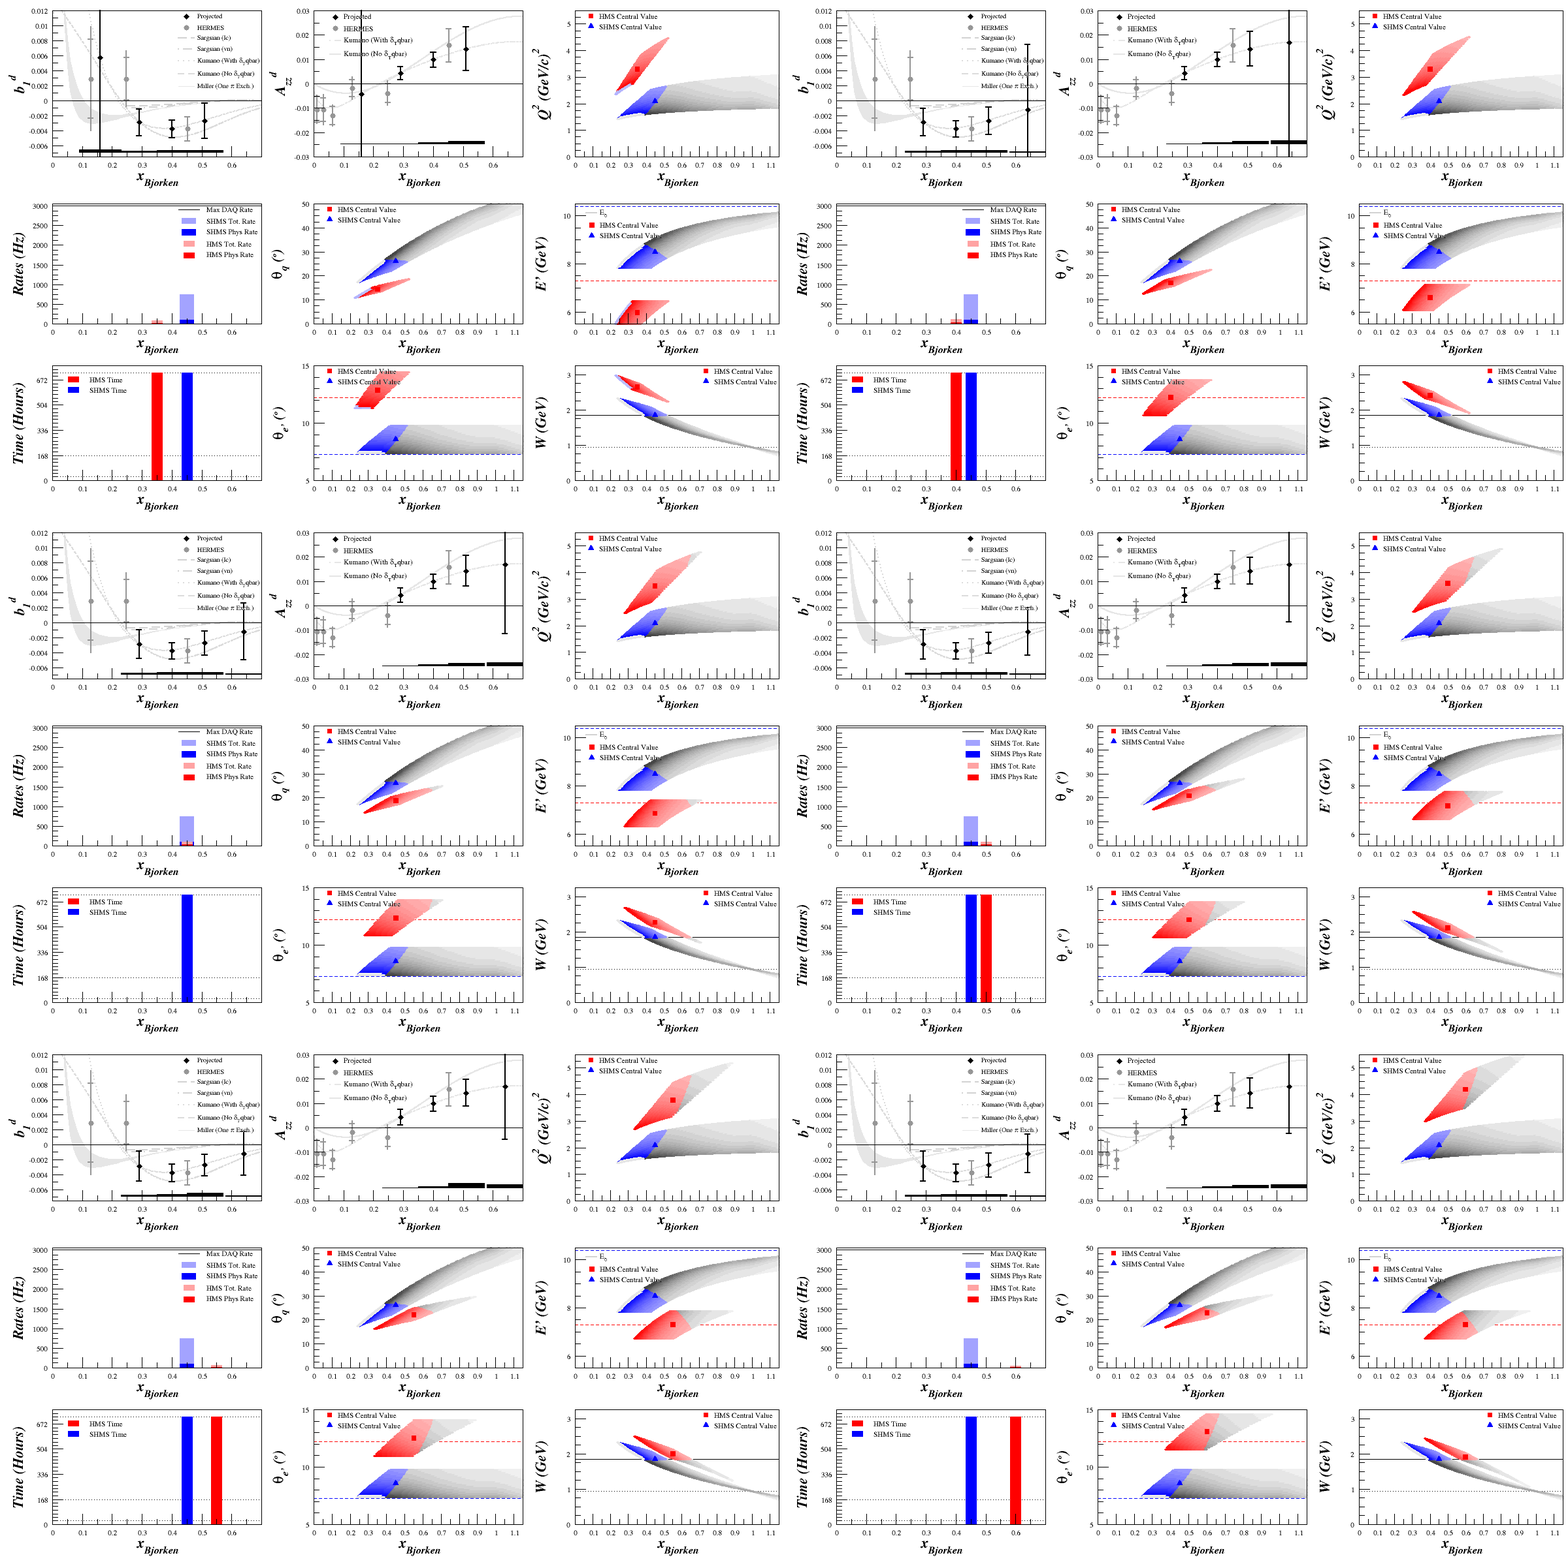
This was followed by an x scan of the HMS
and an x scan of the SHMS.
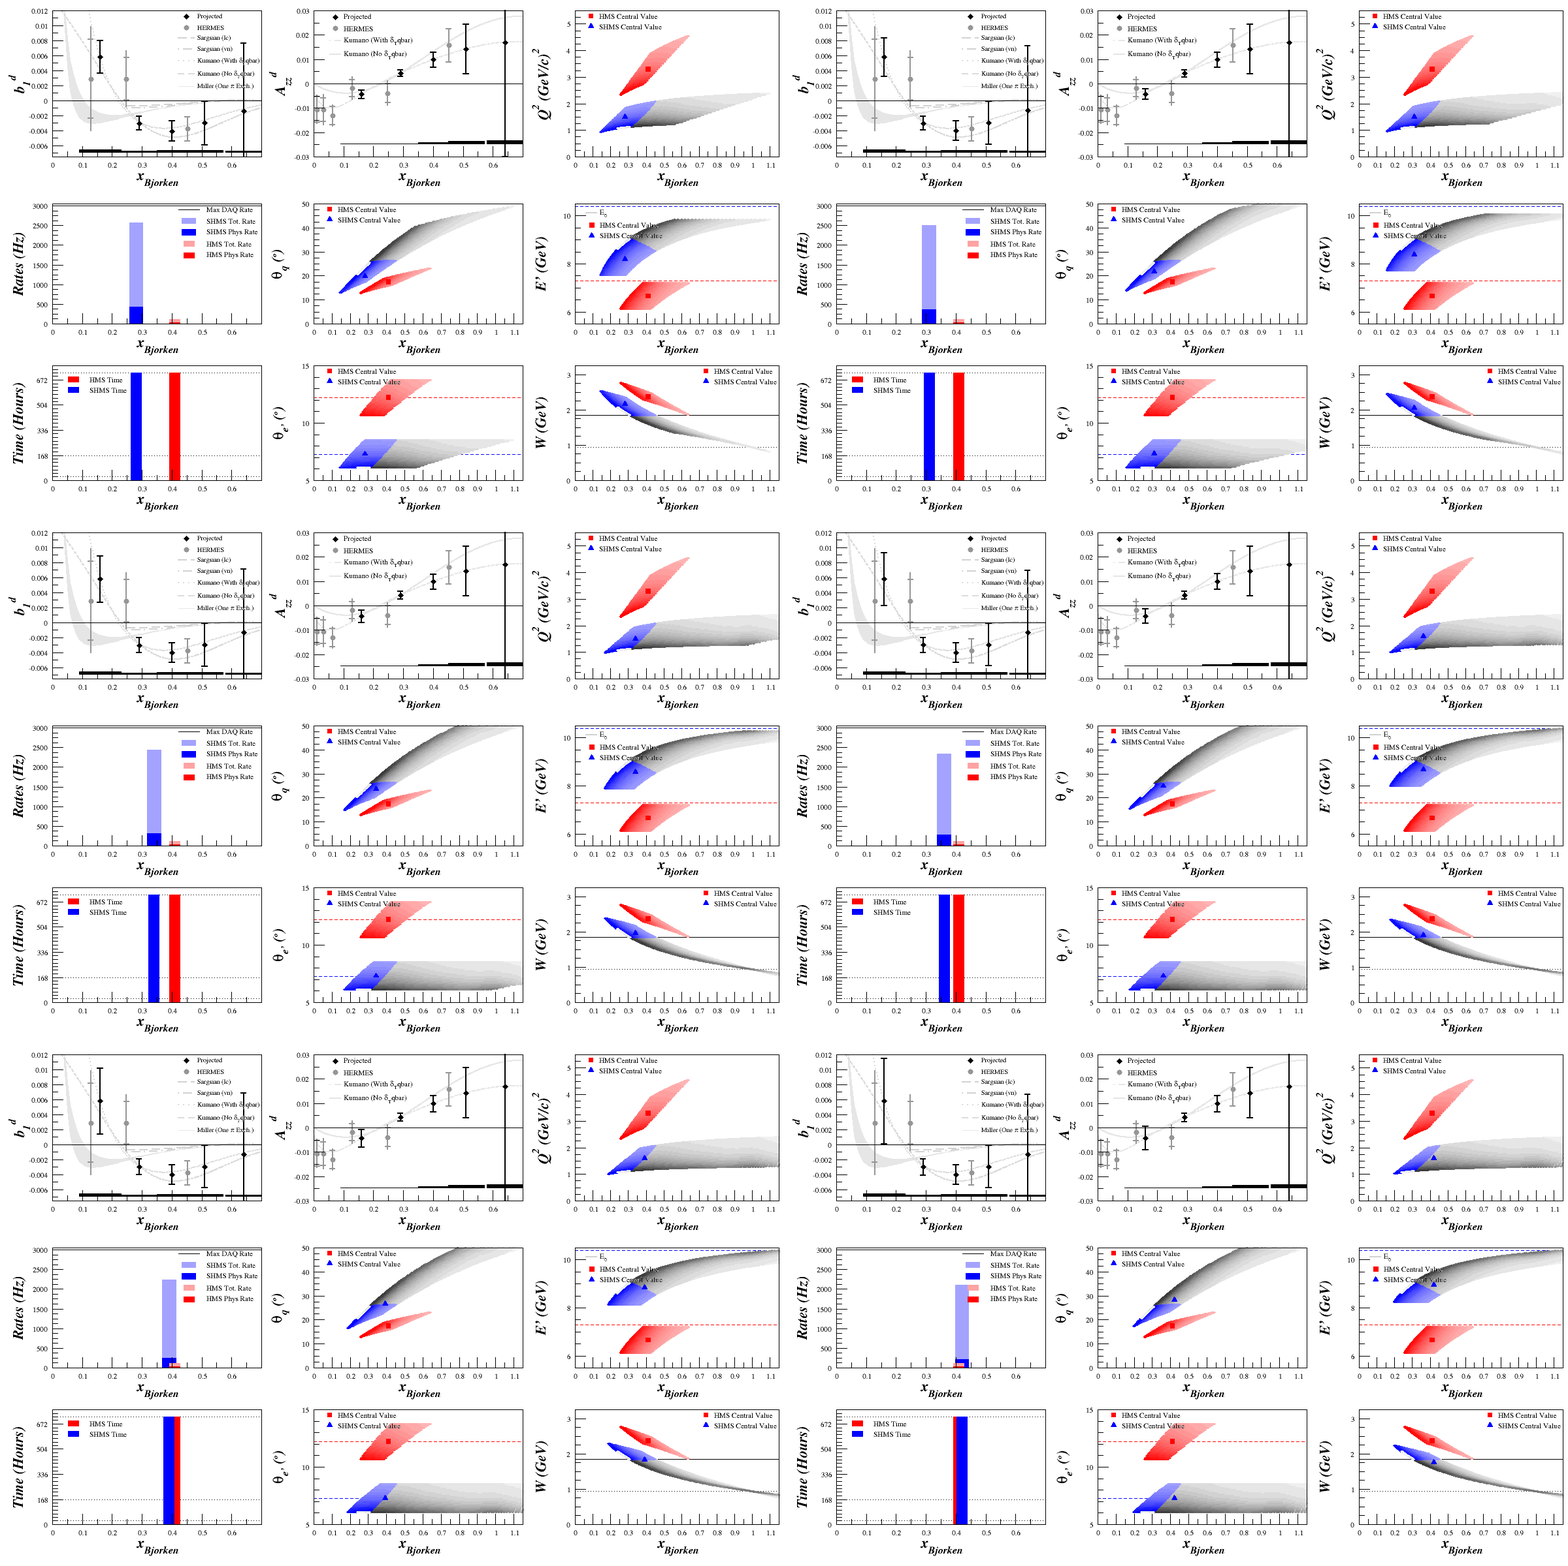
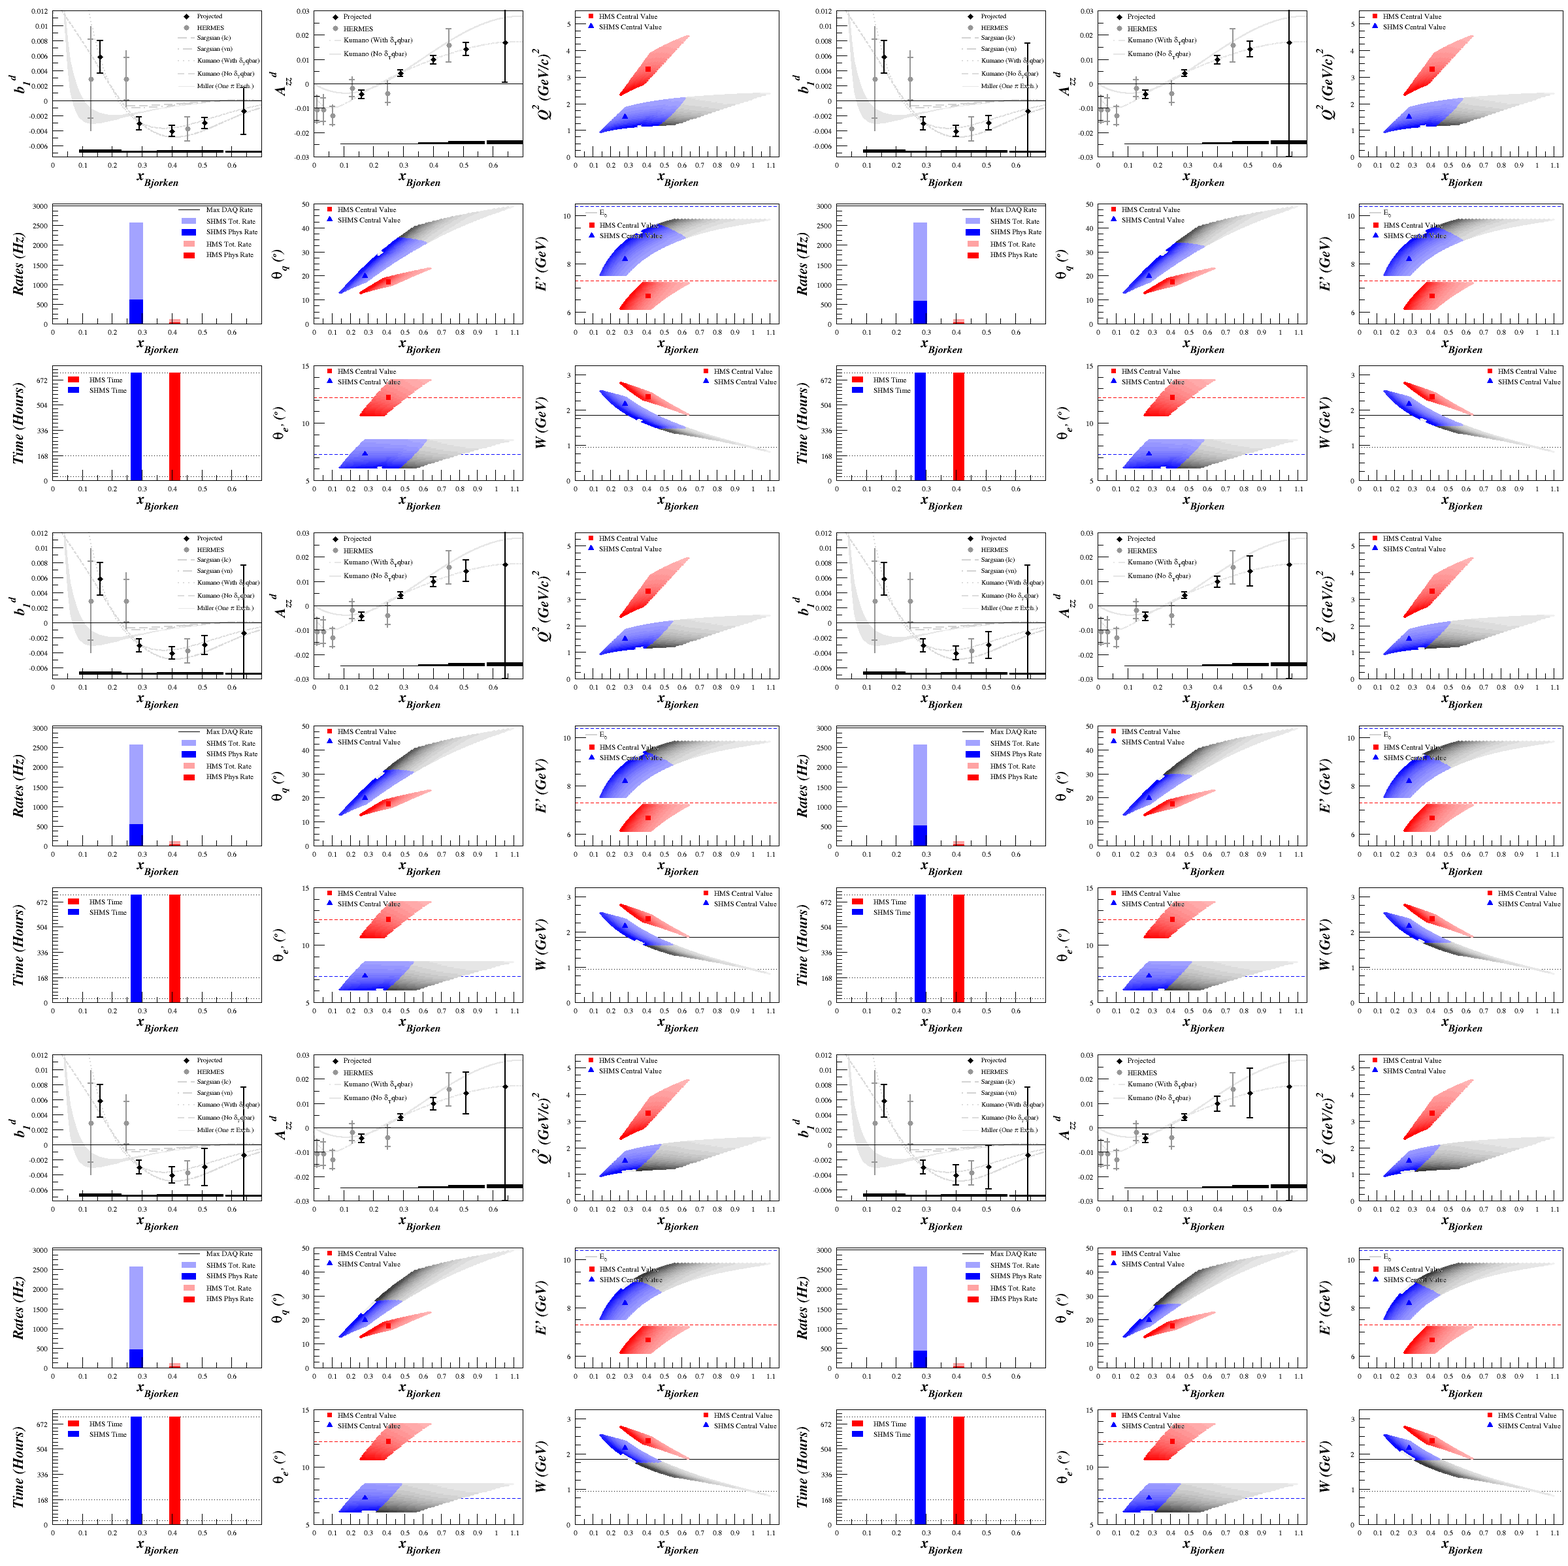
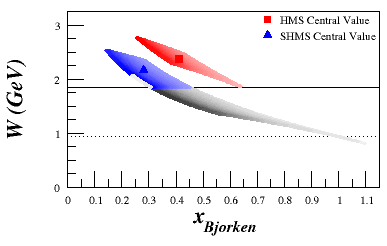
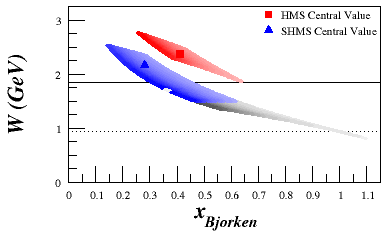
After each of these, it looked like our best point was to put the central SHMS at x=0.28 and Q^2=1.47 with the HMS at x=0.41 and Q^2=3.33. If we do that, and are ok lowering our W^2, we can increase the statistics in the x=0.4 point by opening up the cut
Results
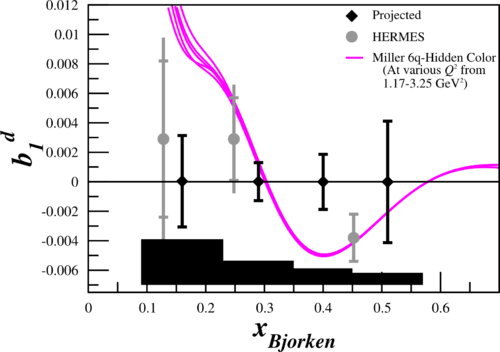
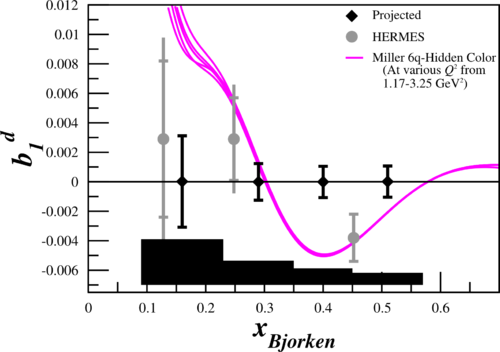
For the plots below, I fixed the systematic uncertainty by assuming that we'll have the same number of cycles for both spectrometers over the full length of time (36 cycles). I also included Gerry Miller's recent 6q-hidden color plots.
Note that for the final results below, the uncertainties are larger than the look above. That's because for the above plots the time was mis-calculated as being half of what it should be for the statistics (i.e. -- it assumed the whole time was used in the polarized state, and then the whole time again for the unpolarized state). For the plots below, this was fixed with half the time being in polarized state and half the time in unpolarized.
If we don't lower the W cut and leave it at W>1.85 GeV, we get
and if we can lower the W cut to W>1.5, we get
--E. Long 17:56, 15 April 2014 (UTC)
