Elong-13-09-12
Adding QE Range
Frankfurt and Strikman's 1988 Azz
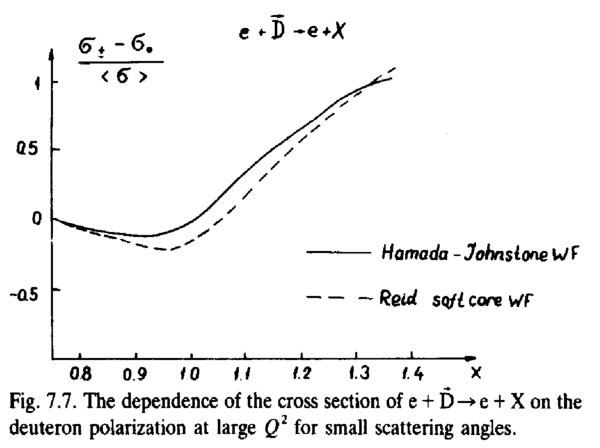
In their 1988 report on Hard Nuclear Processes and Microscopic Structure, Fig. 7.7 plots what appears to be Azz.
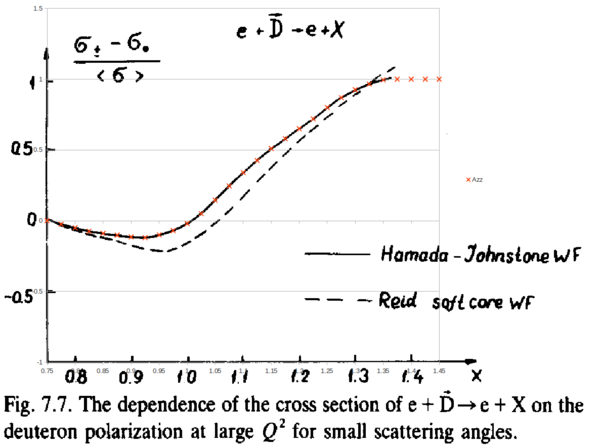
I took this plot and super-imposed it onto a plot in a spreadsheet so that I could estimate points along the curve.
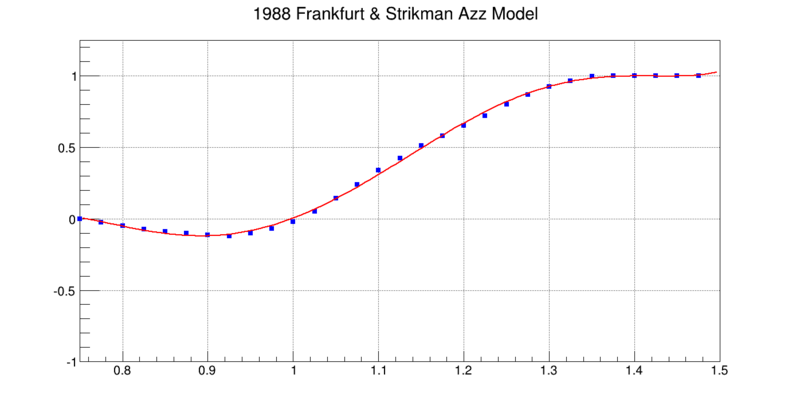
Each of these points, with an uncertainty of ±0.01 on account of my estimating from a previous work without direct points, was then put into a graph in ROOT and fit with a 6th-order polynomial, <math>\sum_{n=0}^6w_n\cdot x^n</math>
<math>n</math> <math>w_n</math> 0 -5.68296e+01 ± 1.22251e-02 1 2.46102e+02 ± 1.66137e-02 2 -3.51484e+02 ± 1.39410e-02 3 1.11641e+02 ± 1.11237e-02 4 1.63698e+02 ± 8.63783e-03 5 -1.48174e+02 ± 6.15266e-03 6 3.50491e+01 ± 3.63922e-03
This fit was written up as a subroutine for the b1 rates code. It also assumes that at x>1.425, Azz=1 and that at x<0.75, Azz=0. The b1 rates code was then updated to use the previous Kumano curves for x<0.75 and this new QE curve for x>=0.75.
Q2 Scan
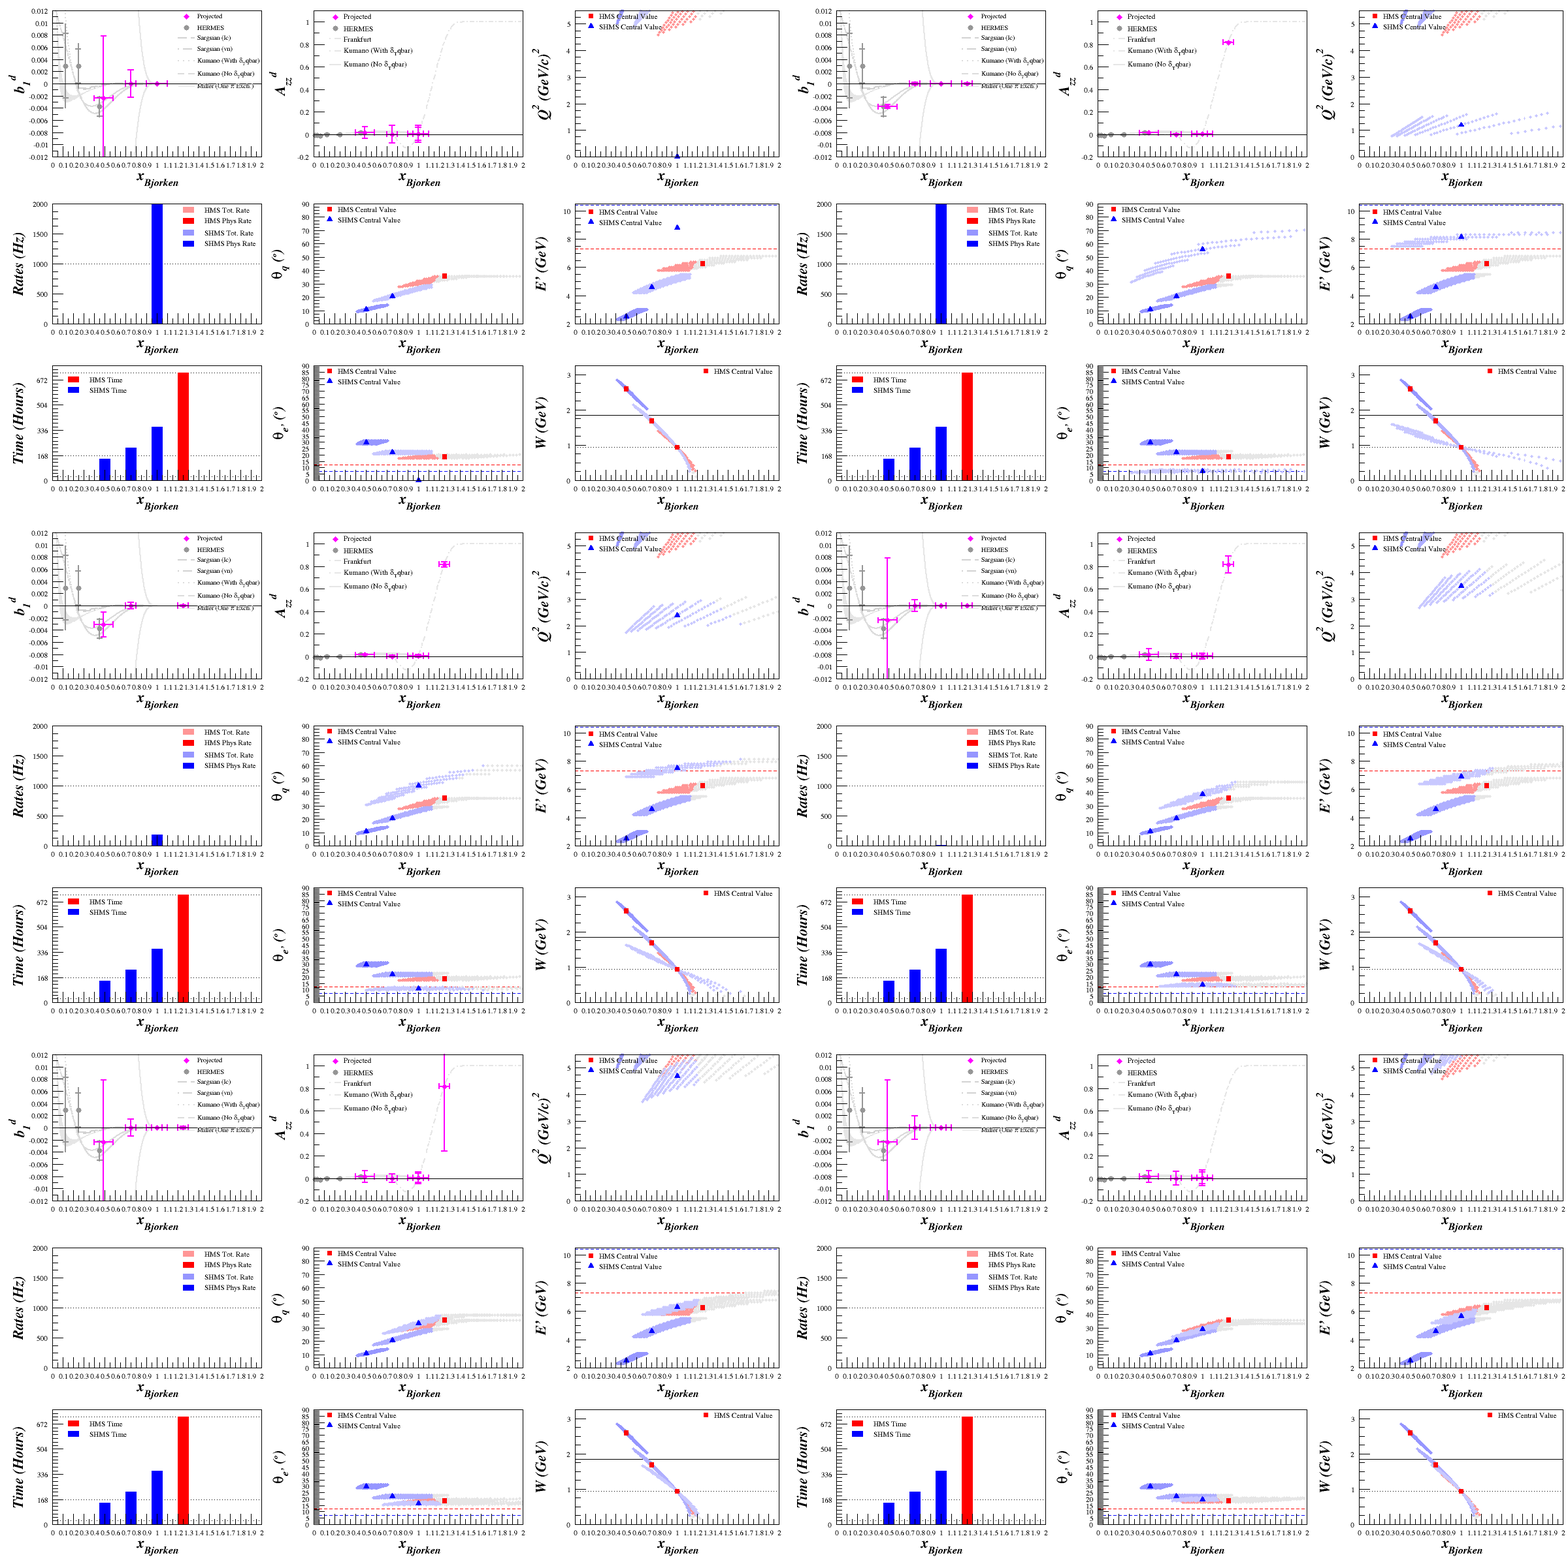
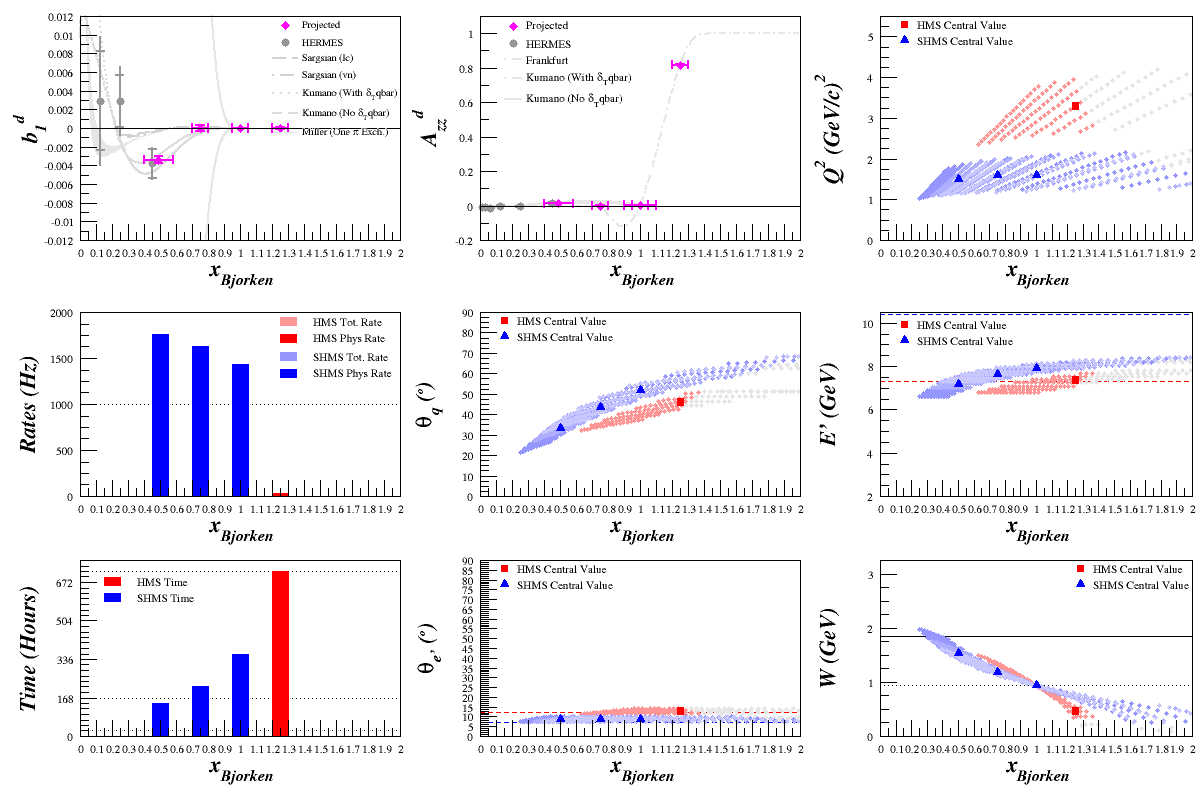
Starting with x=0.5, 0.75, 1.0, and 1.25 and including the Frankfurt and Strikman plot for Azz in the Quasi-Elastic range, I scanned over the spectrometers' center Q^2 values, looking for the best rates that fall within the spectrometers' limits. (All plots assume Pzz=35%)
First Pass Results
This is still a work in progress (for example, the lowest x point in b1 moves a bit which is caused by fluctuations in F1 moving from inelastic to quasi-elastic scattering in calculating the point) and I'll be continuing to look at different x points to perhaps make a smoother transition, especially where Azz goes from near-zero to very large values. But at the moment, here's a rates estimate for a potential measurement:
HMS Q2 Scan
HMS Q2 Scan
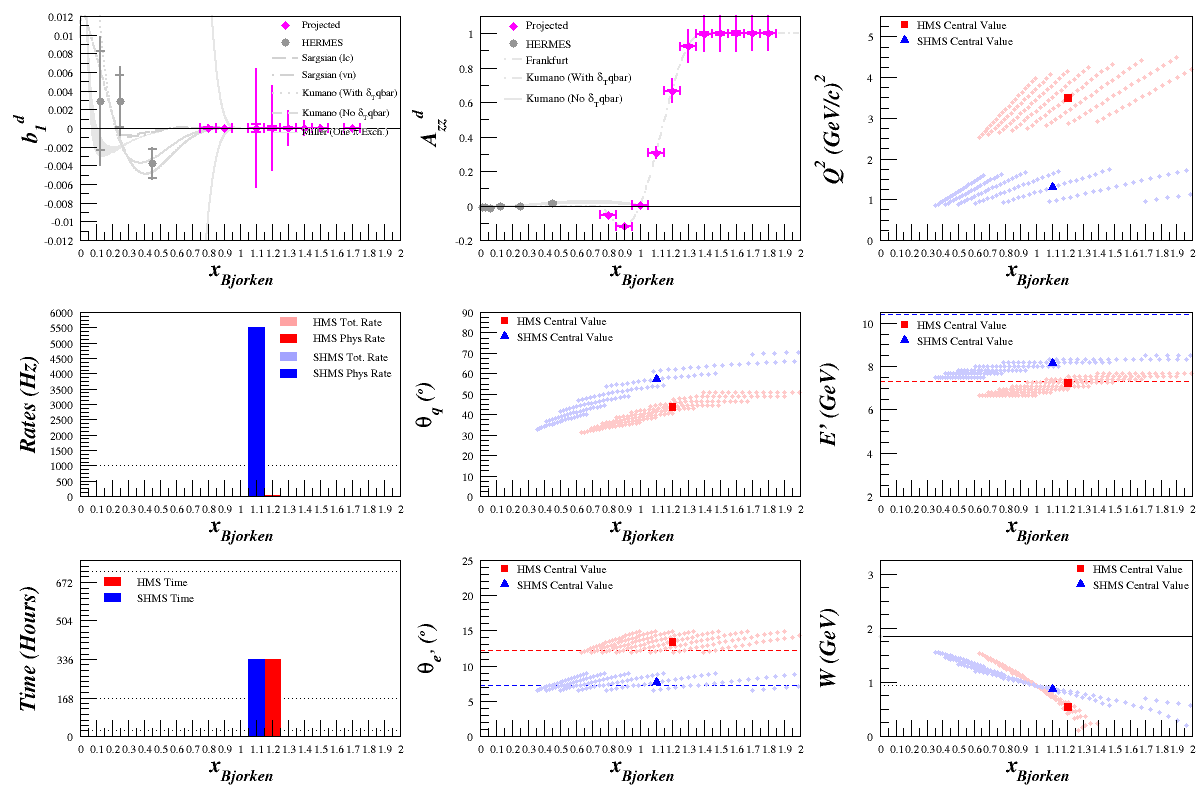
Single Setting, 2 Week Measurement
First attempt at extending the number of rebinned events in x and putting the SHMS and the HMS at a single setting for two weeks. Still need to include the fact that the large asymmetry uncertainty isn't included (currently 1/sqrt(N), not applicable as Azz>>0) and double-check that the cross sections match what I expect in the QE region.
--E. Long 22:10, 13 September 2013 (UTC)
