Elong-15-04-30
Background
As mentioned previously, I was able to calculate the elastic cross section using a parameterization of the deuteron's elastic form factors. With the A and B form factors, the cross section was estimated as
$\sigma = \sigma_{Mott} \left[ A + B \tan^2 \left( \frac{\theta}{2} \right) \right]$
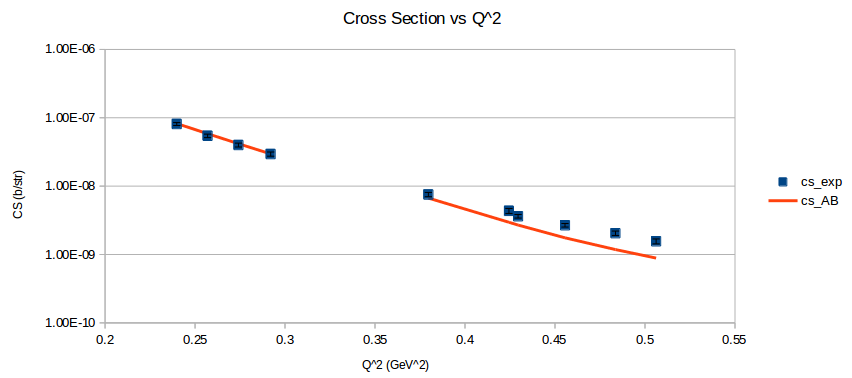
I found a paper from Galster (1971) that included elastic cross sections (and not just A and B), which I was able to reproduce well. (Note: The dip around Q2=0.5 is because of the parameterization underestimating A in that region.)
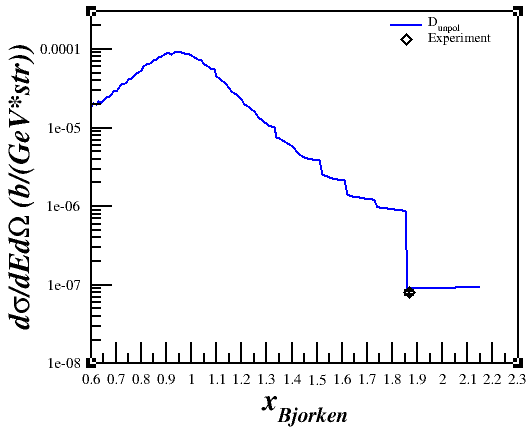
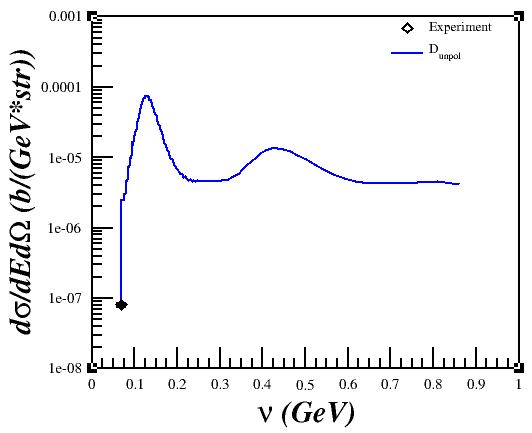
However, when I would plot it versus x or nu,
I wasn't getting what I was expecting in relation to the QE peak.
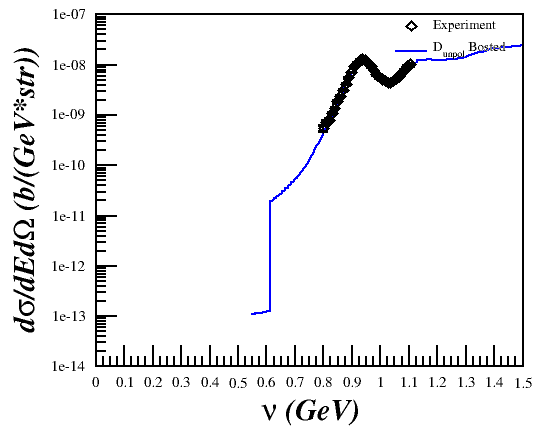
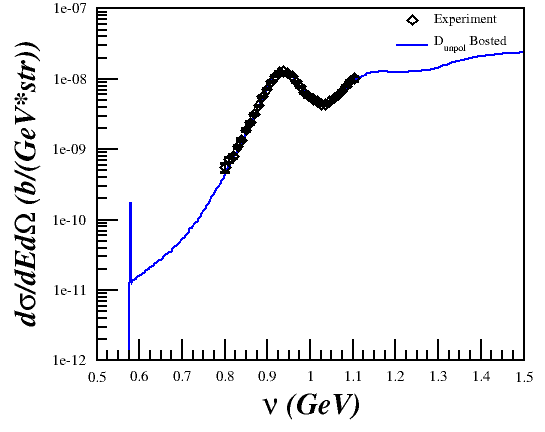
For a sanity check, I also plotted against QE data to make sure that the Bosted part of the code was doing what it should.
The Fix
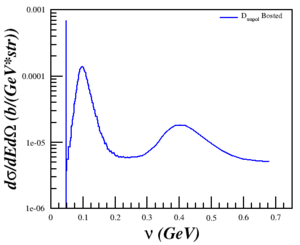
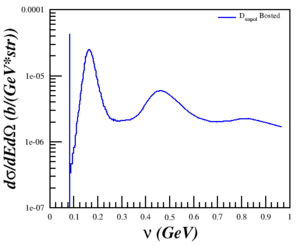
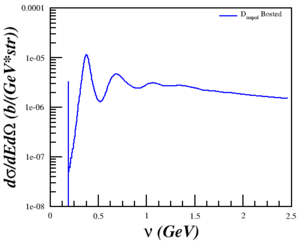
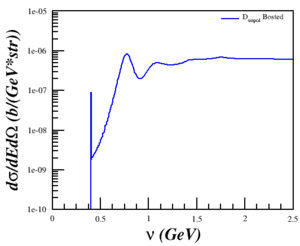
Discussing the issue with Doug and Donal, I realized that the problem was that I was trying to compare a single-derivative elastic cross section with a double-derivative QE cross section, so what I was plotting was the area of the elastic peak and not the peak itself. This was fixed by using a delta function, estimated as $\delta(E'-E'_{el}) \approx \frac{n}{\sqrt{\pi}}e^{-n^2 (E'-E'_{el})^2}$ with $n = 5000$ and $E'_{el}=\frac{Q^2}{(2M_D)}$, to the cross section. Now, the cross section is calculated by
$\sigma = \sigma_{Bosted} + \sigma_{elastic}$
where
$\sigma_{elastic} = \sigma_{Mott} \left[ A + B \tan^2 \left( \frac{\theta}{2} \right) \right]\delta(E'-E'_{el})$
behaves as expected. I can also "smear" the elastic peak more with smaller n, but since the code integrates over E' and the area under the elastic peak never changes it should be fine either way.
| $Q^2 = 0.18$ (GeV2) | $Q^2 = 0.31$ (GeV2) | $Q^2 = 0.71$ (GeV2) | $Q^2 = 1.50$ (GeV2) | $Q^2 = 1.80$ (GeV2) |
|---|---|---|---|---|
 |
 |
 |
 |
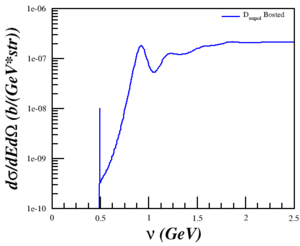
|
My sanity-check with the Lung data (Q^2=1.73 GeV^2) now makes more sense as well.
The Rates
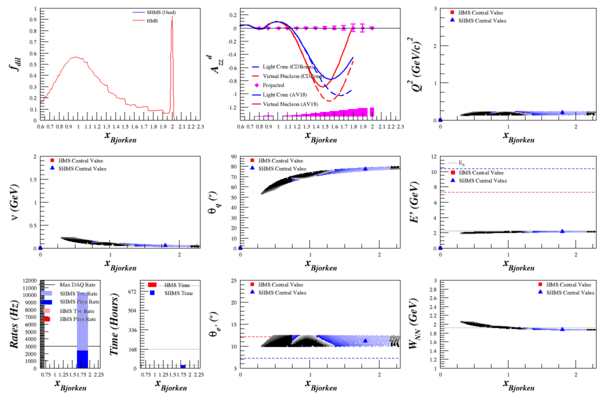
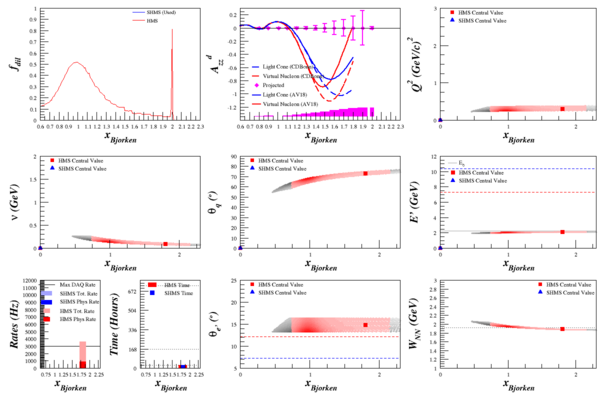
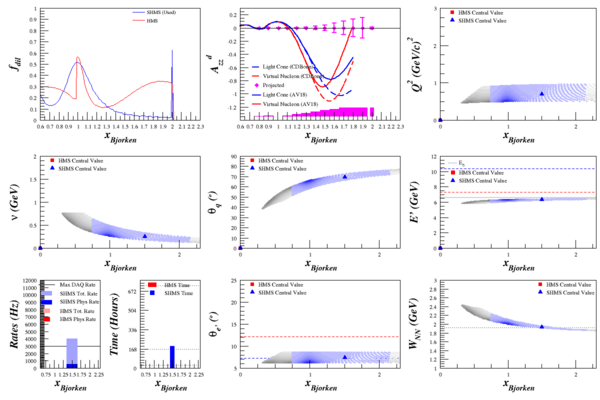
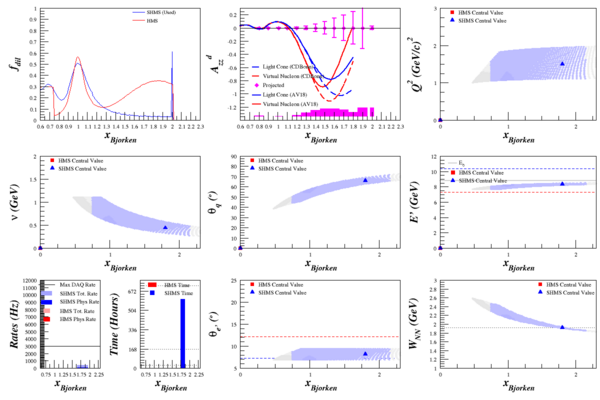
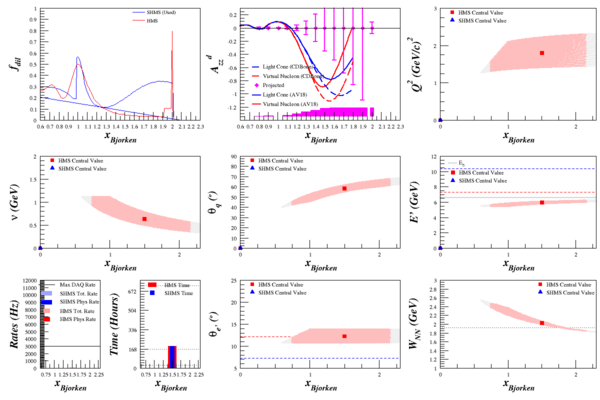
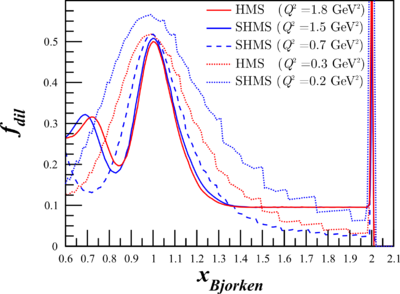
My rates code requires double-derivative $\frac{d^2\sigma}{d\Omega dE'}$ cross section to work, as it algebraically integrates over small bins in $\Omega$ and $E'$. Running this through the rates code allowed me to calculate elastic $A_{zz}$, which has significantly smaller uncertainty from its QE neighbors due to the spike in the dilution factor.
Note1: Ignore the LC and VN curves on all but the E=8.8 GeV plots. I was interested just in x=2 for the moment, and lazily didn't remove them.
Note2: For E=8.8 GeV, ignore the x<2 QE Azz uncertainties. It uses the Bosted model, because the elastic calculations didn't play nice next to Misak's model. If you remember, Misak's model gives us a more accurate dilution factor in this region.
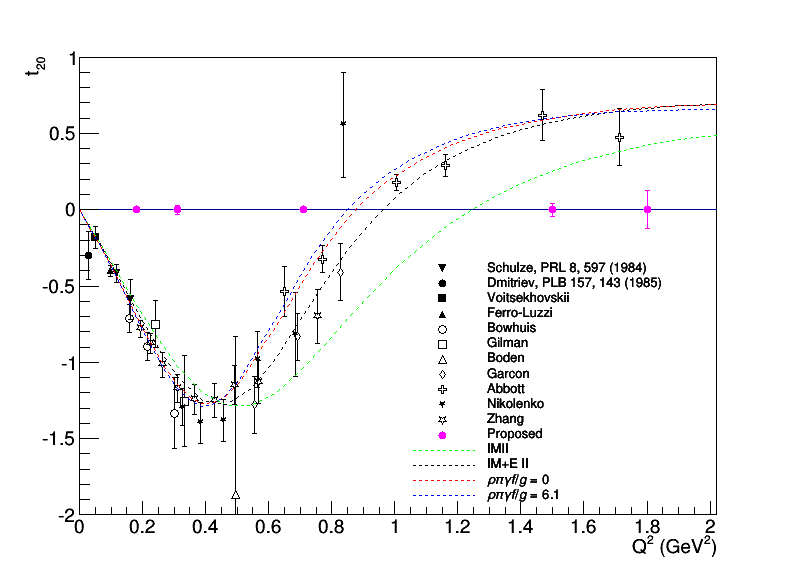
$T_{20}$
With all of the above, I can now better calculate the statistical uncertainty we expect for $T_{20}$. Note that the difference between this and what I showed before comes nearly entirely from increase in the dilution factor at x=2. Without that, you can follow the trend of the 1<x<2 Azz points above to see what we would expect, which is (more-or-less) what I was plotting previously.
