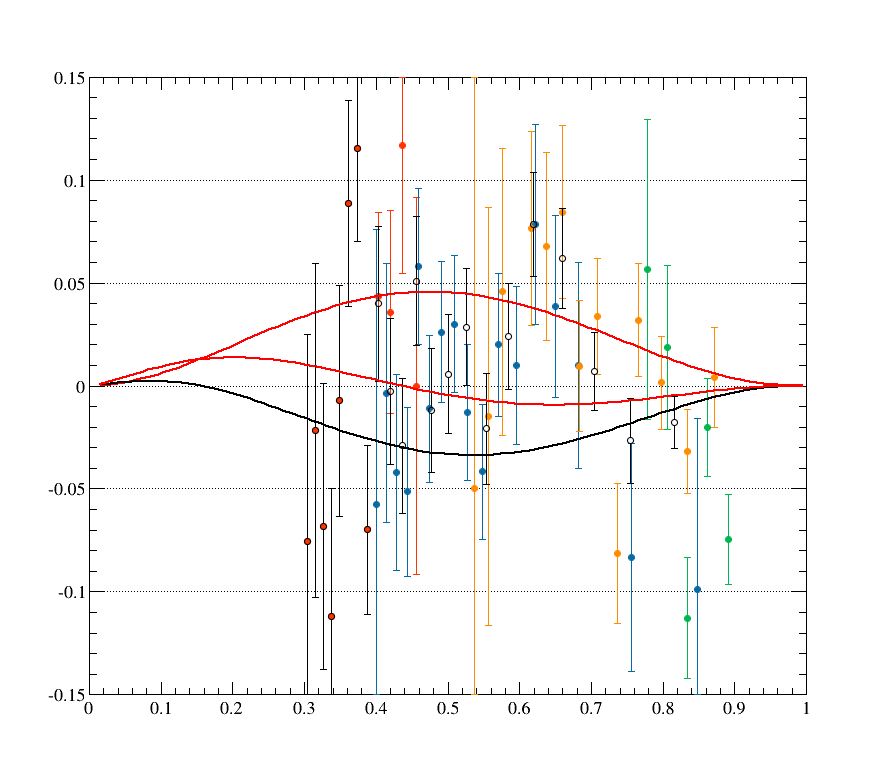
After talking to Oscar last week, I decided to look into the charge and livetime calculations.
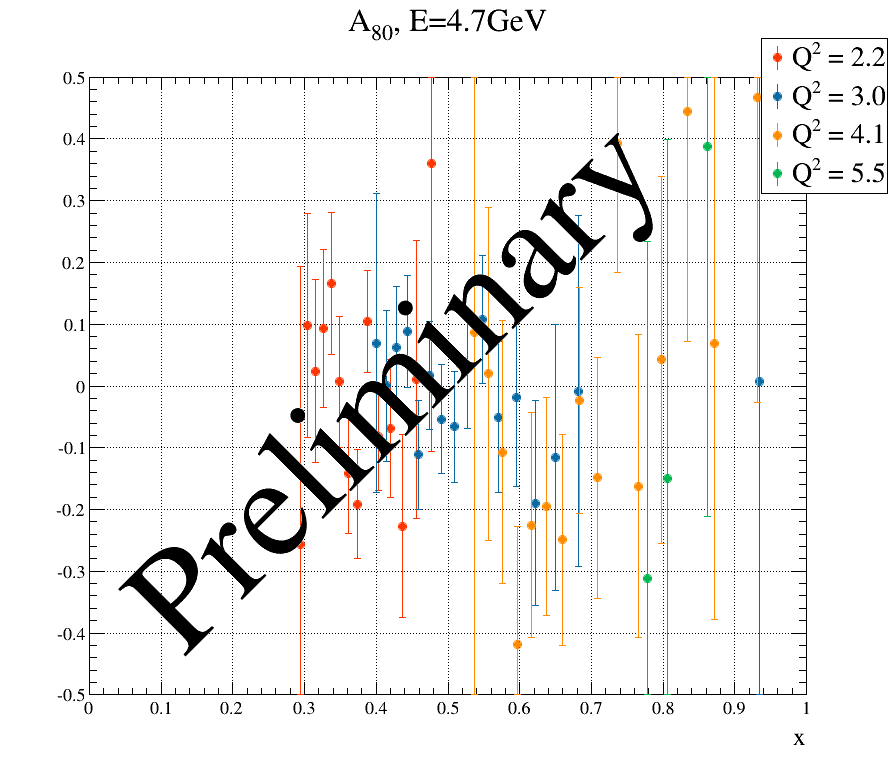
Upon making some improvements, the asymmetries look a bit more stable.
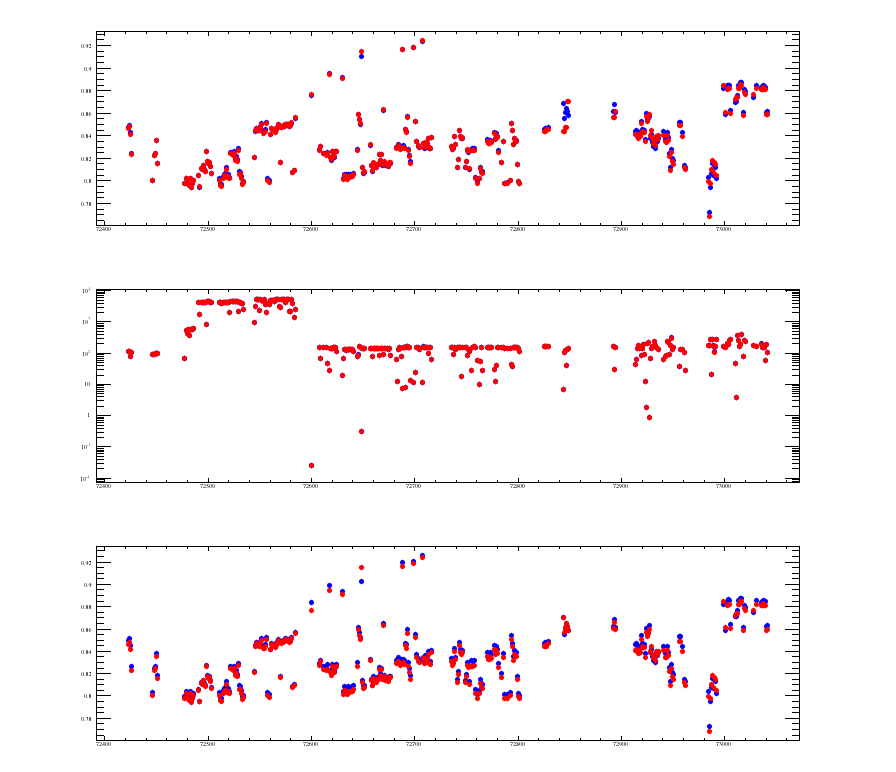
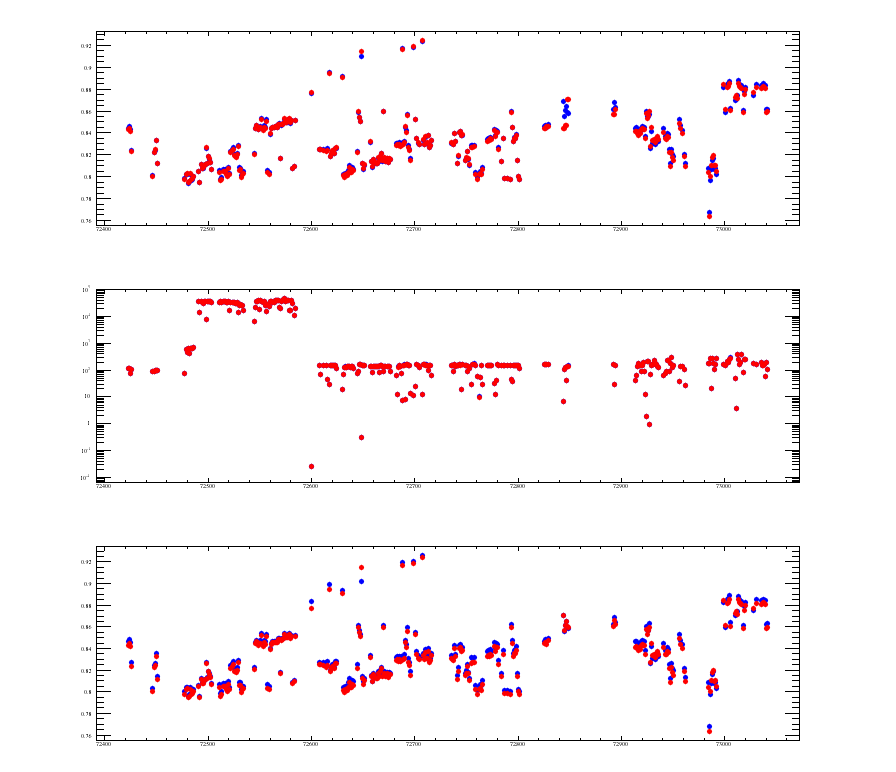
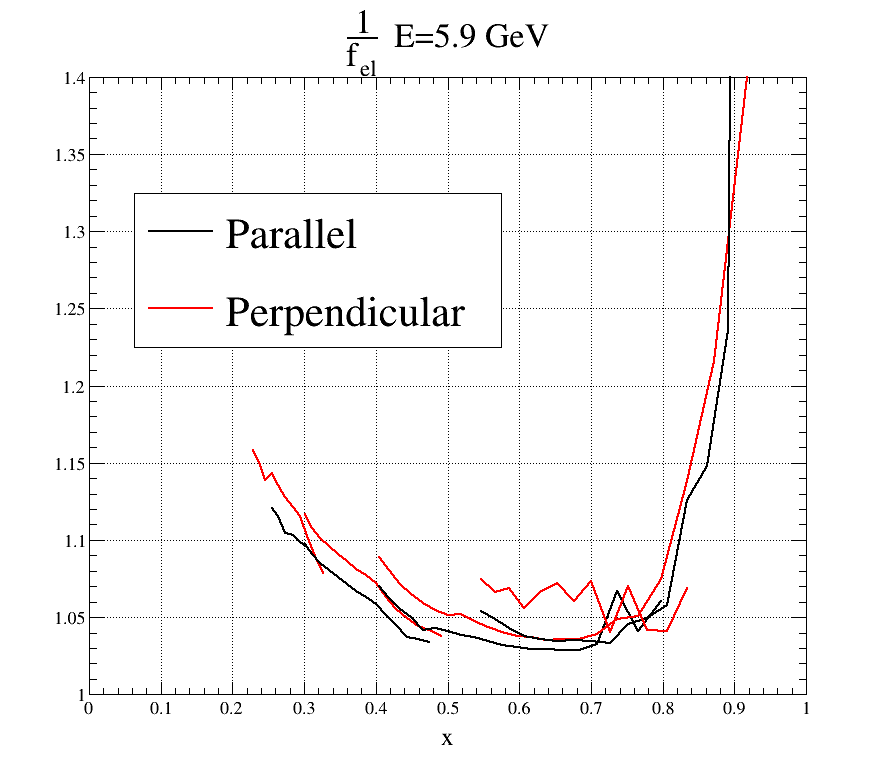
See the difference between the livetime plots labeled 99 and 111.
livetime-99
livetime-111
These plots show: The livetimes per helicity (TOP), the charges per helicity (MIDDLE), the charge*livetime per helicity (BOTTOM).
The difference mostly comes from the charge calculation which was done following Mark's CVS commit.
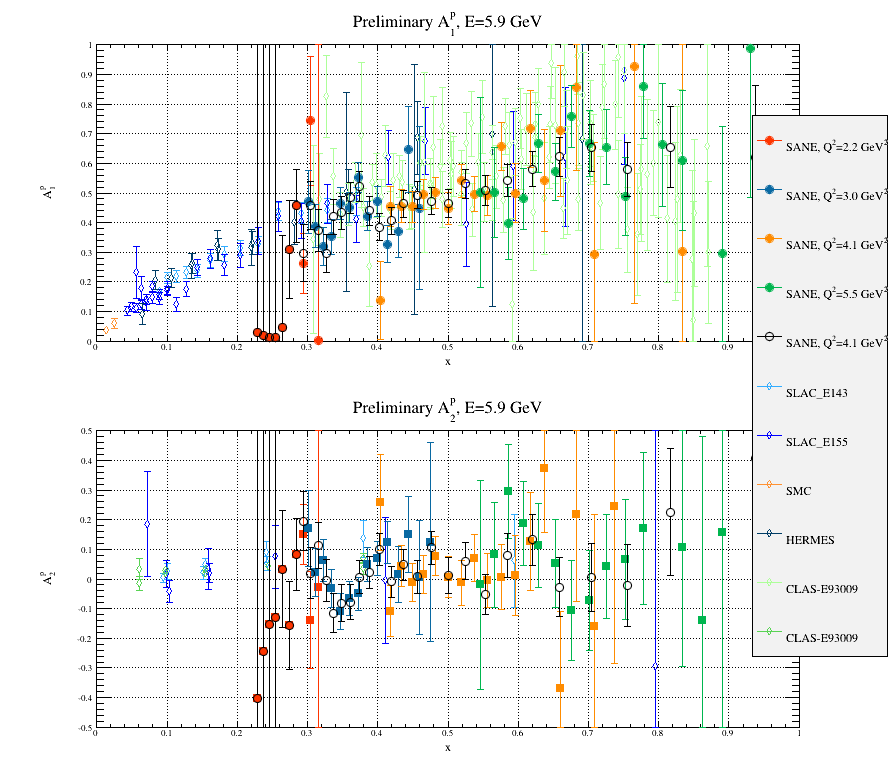
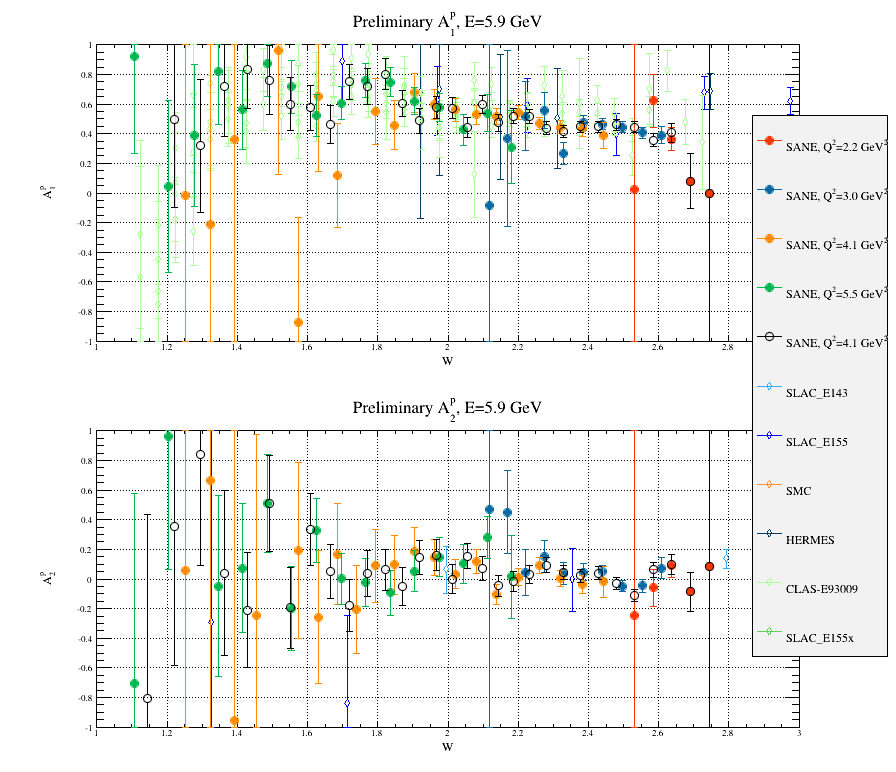
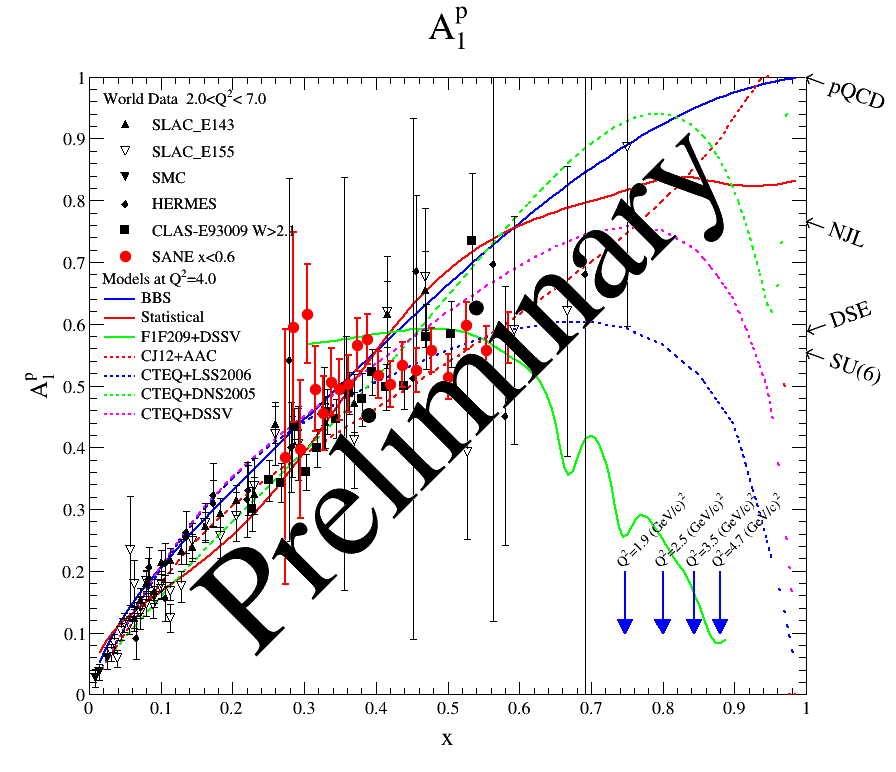
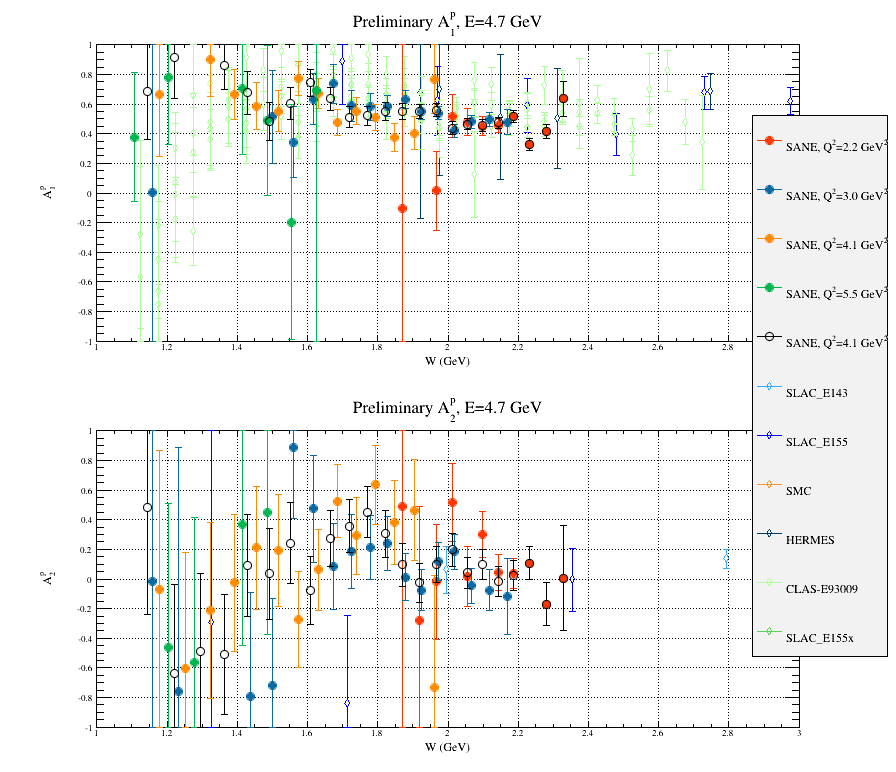
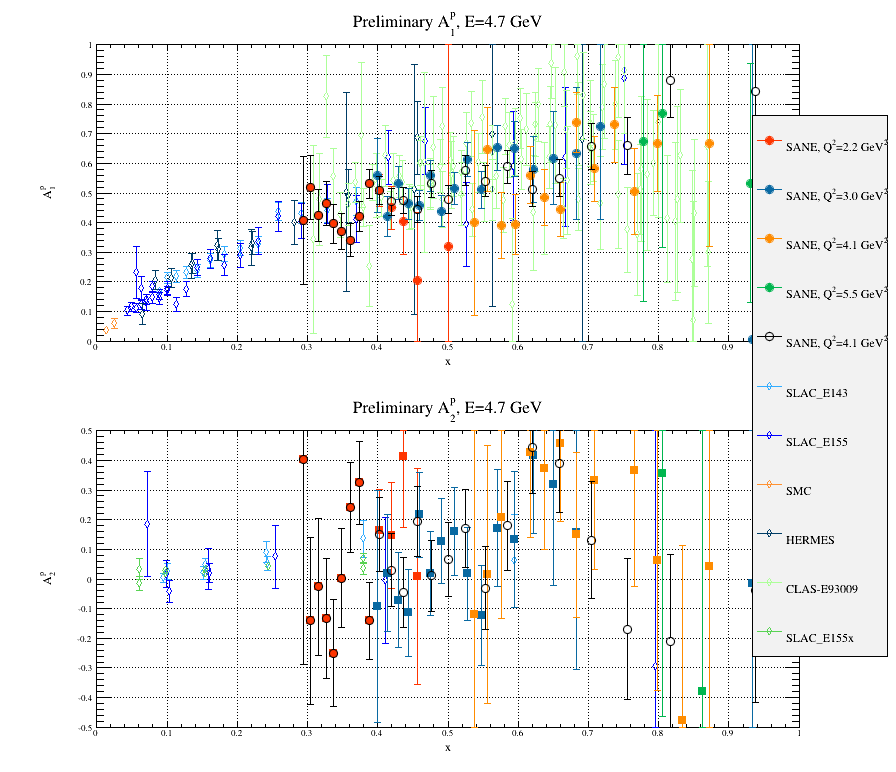
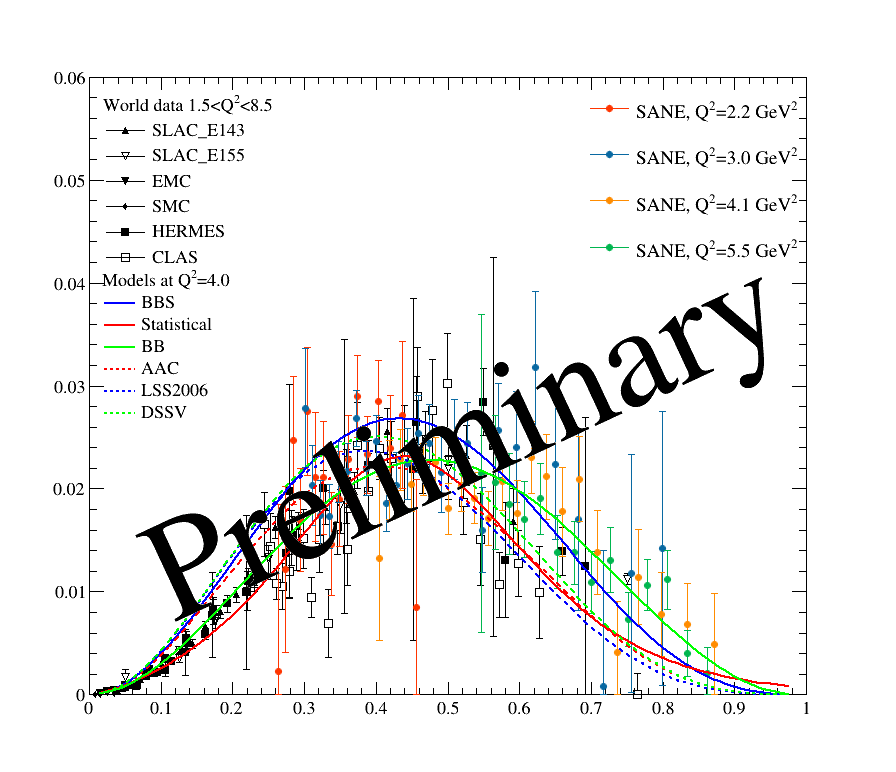
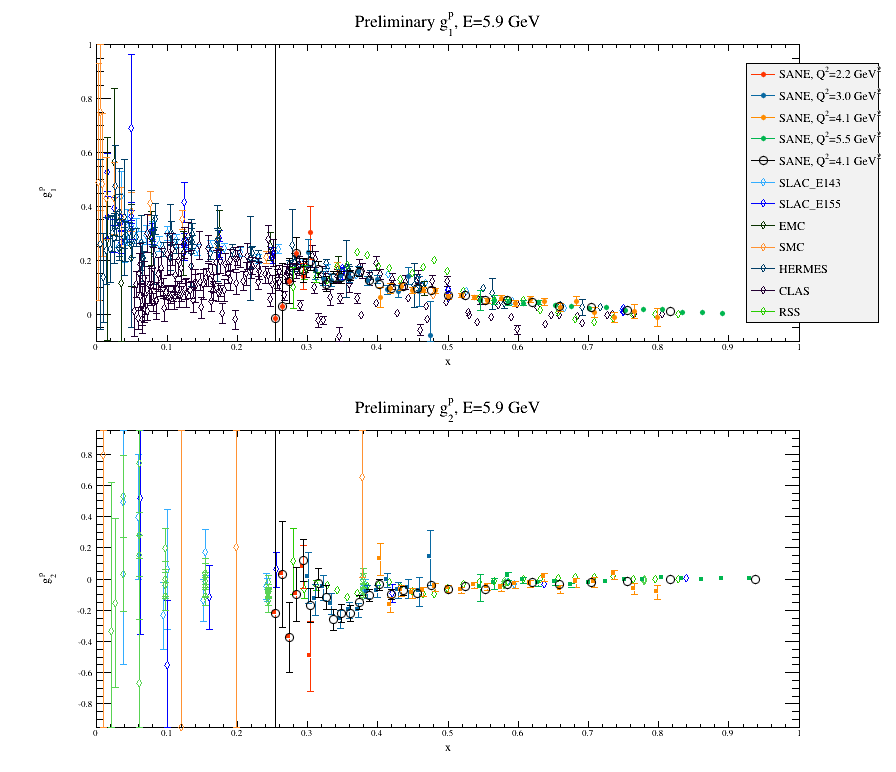
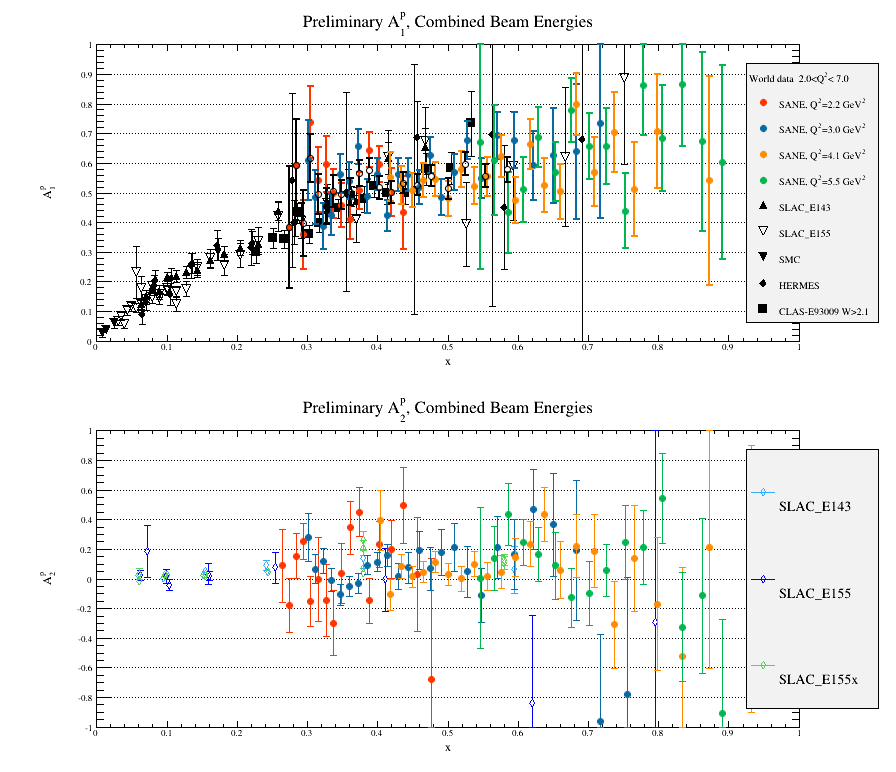
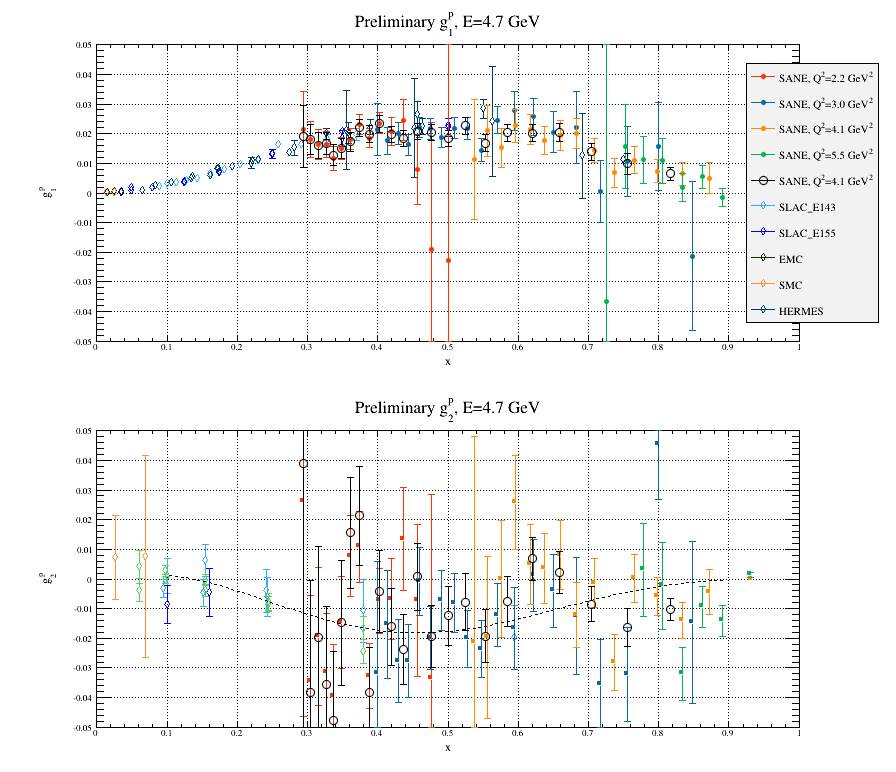
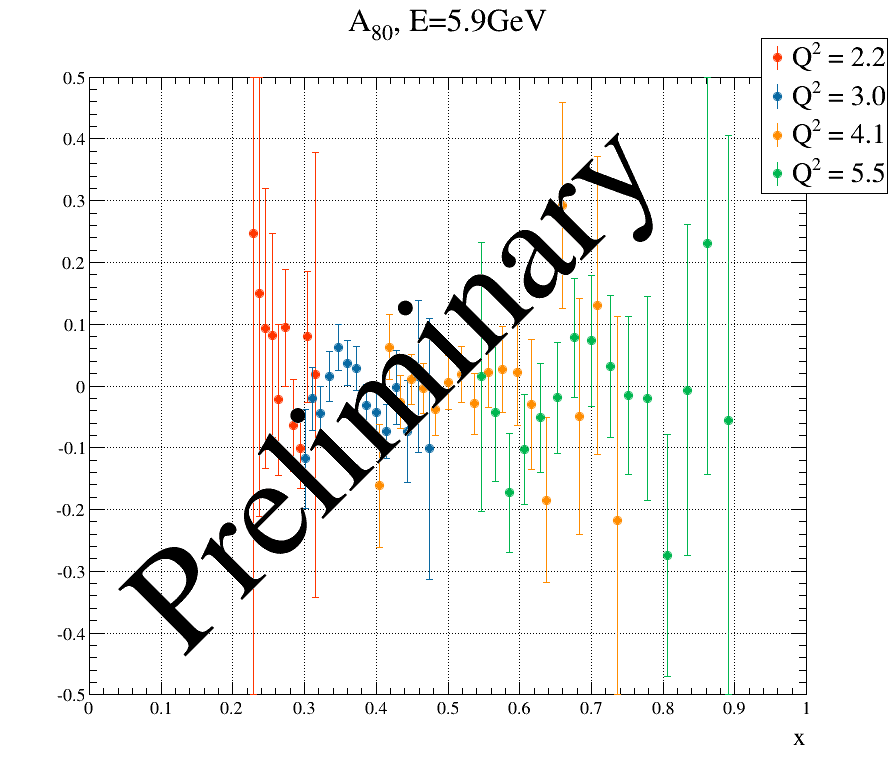
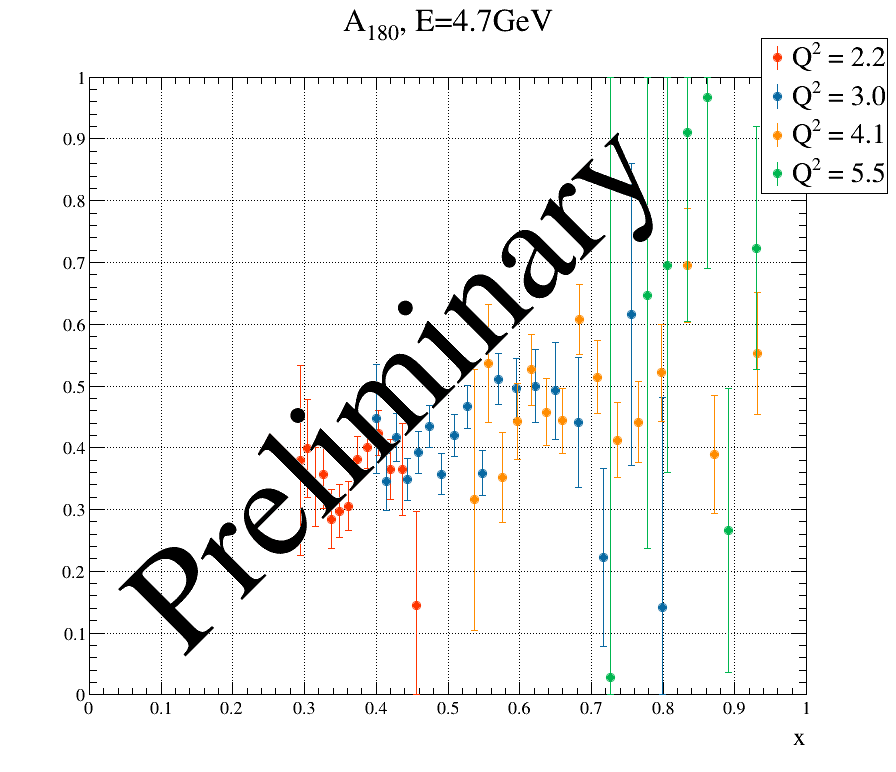
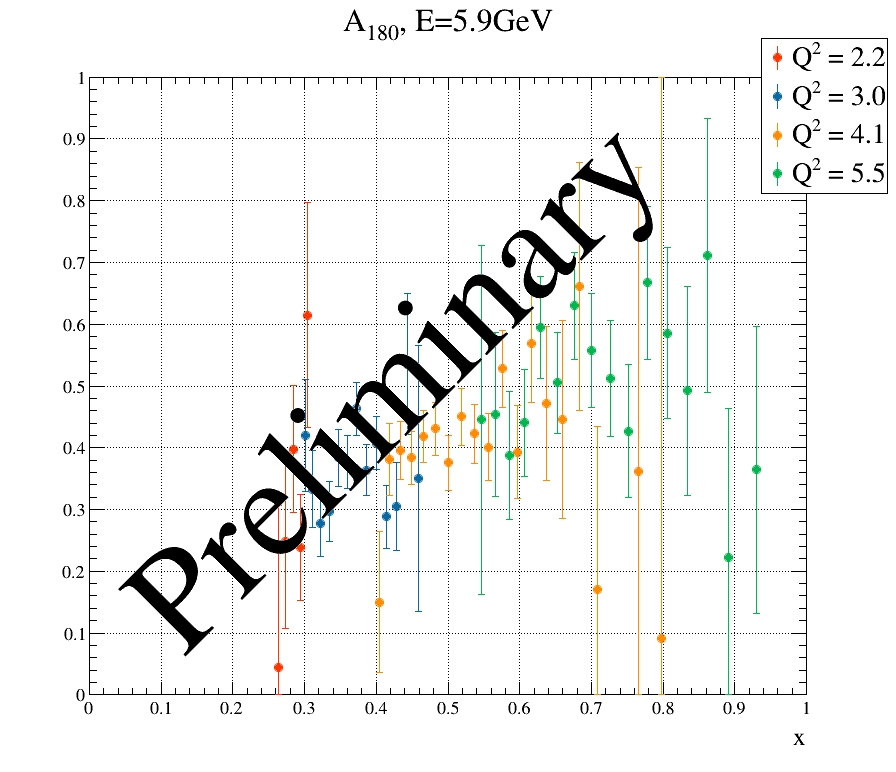
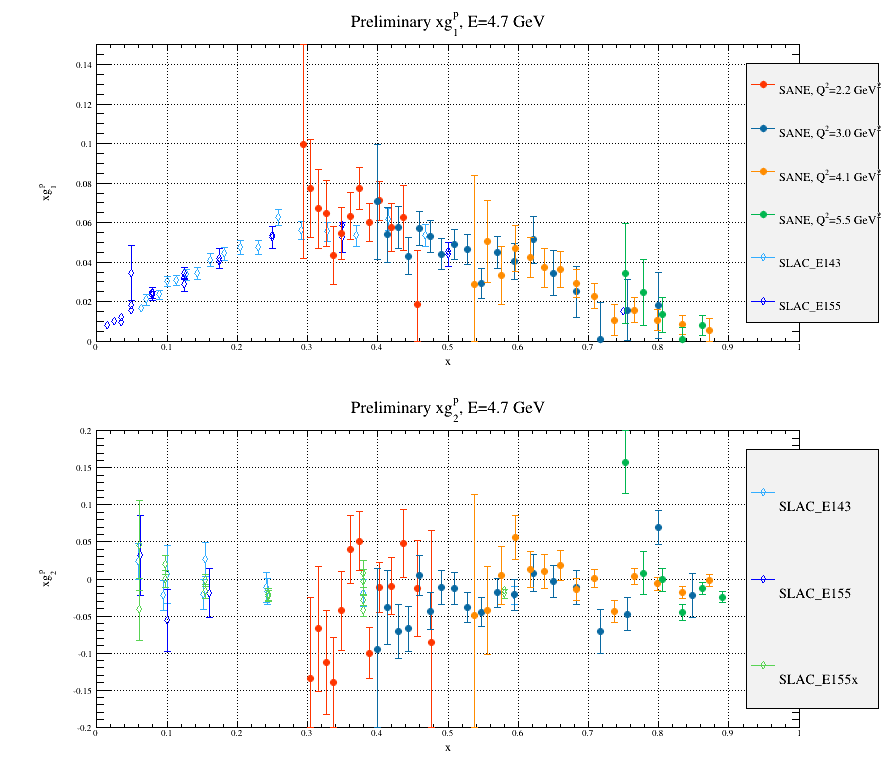
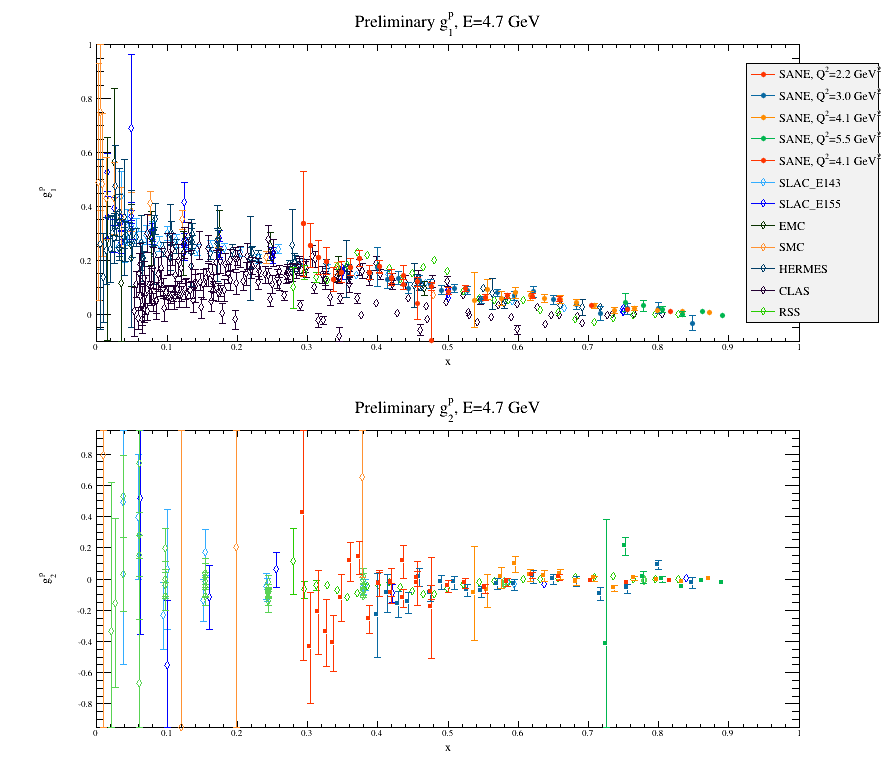
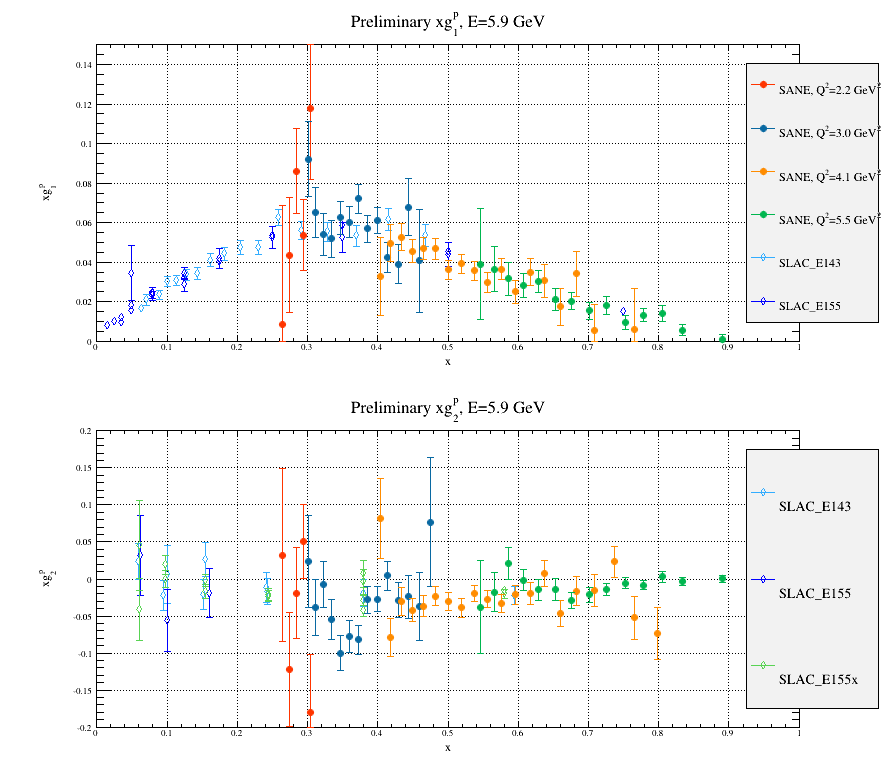
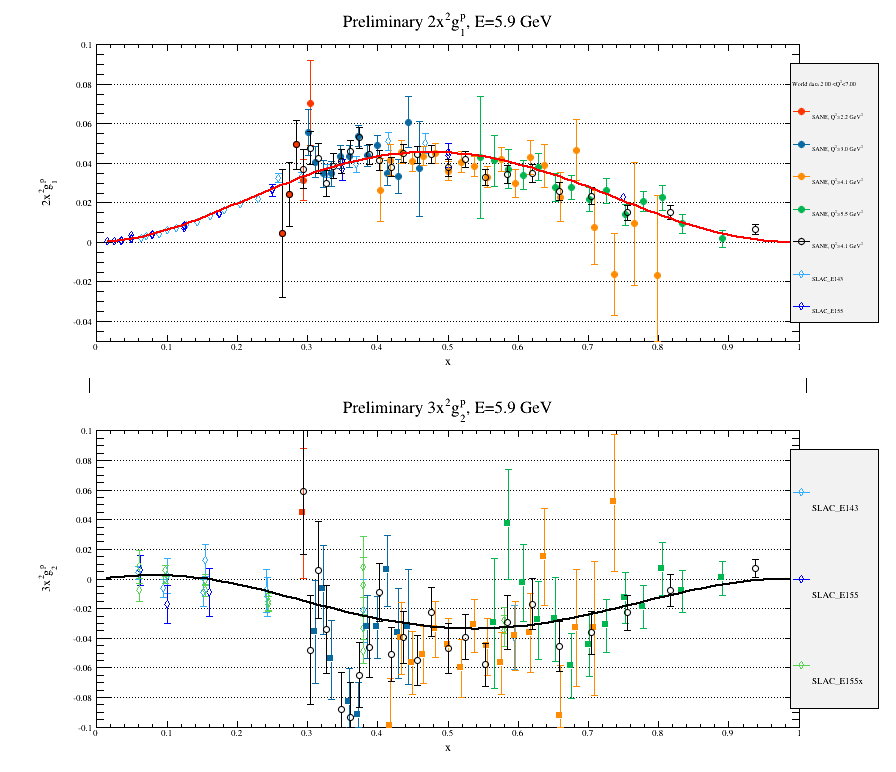
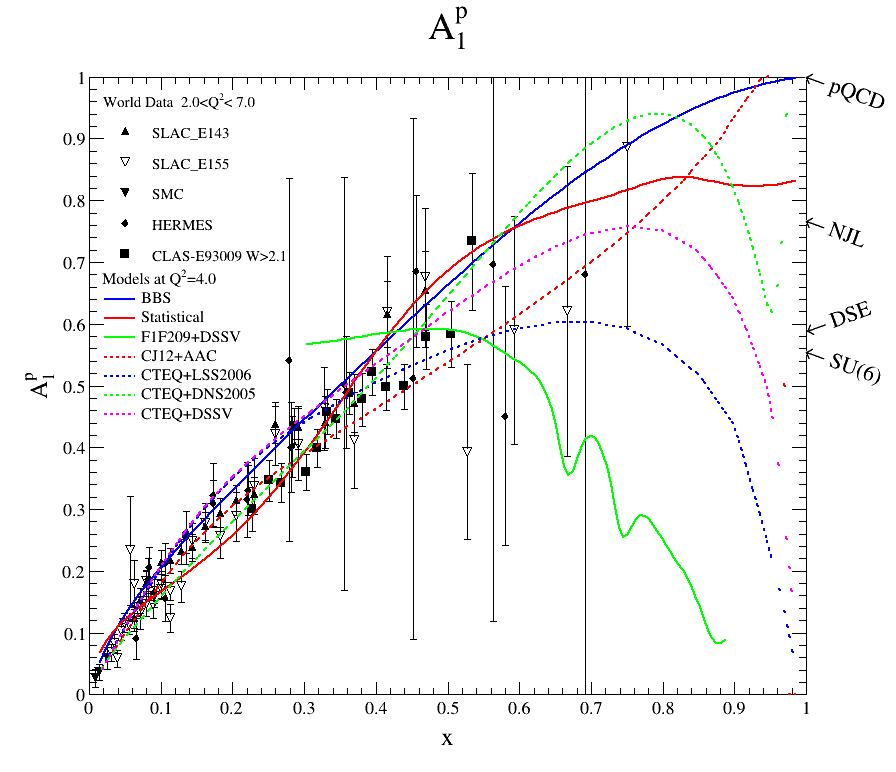
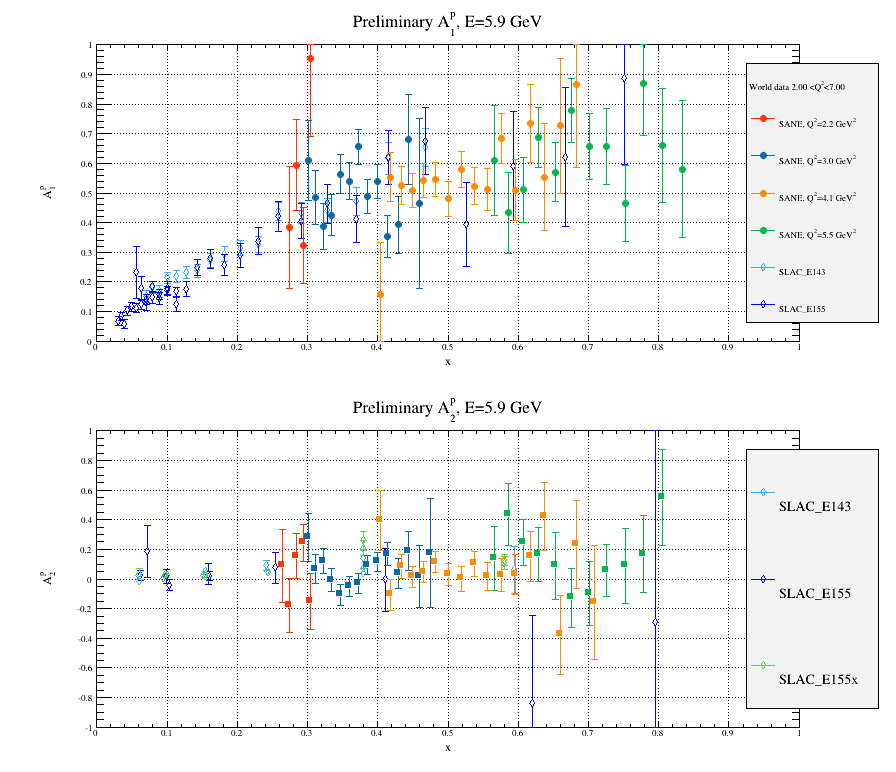
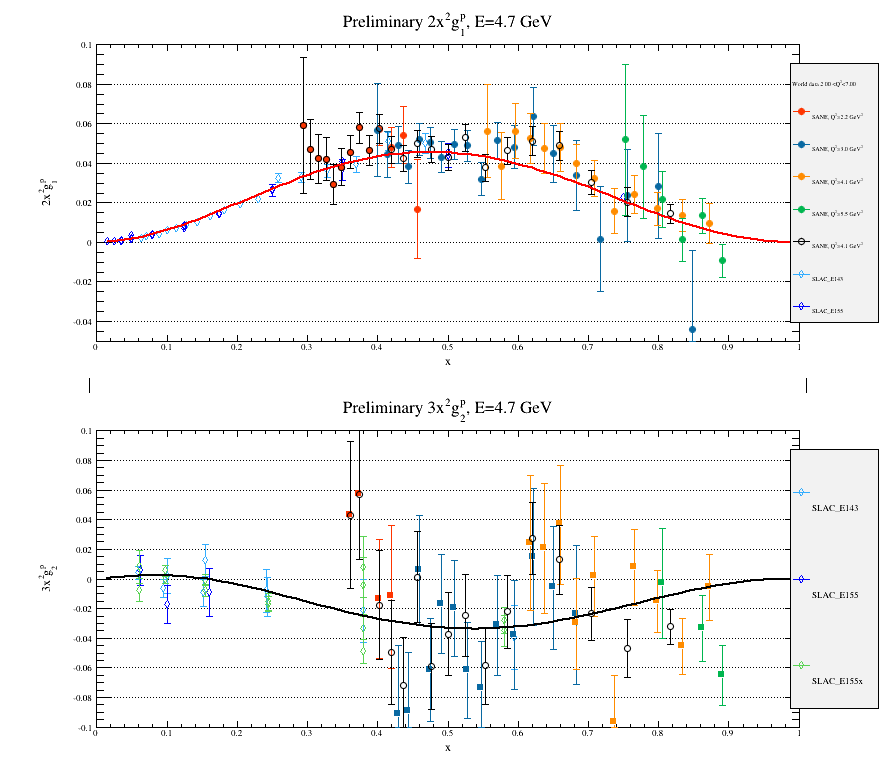
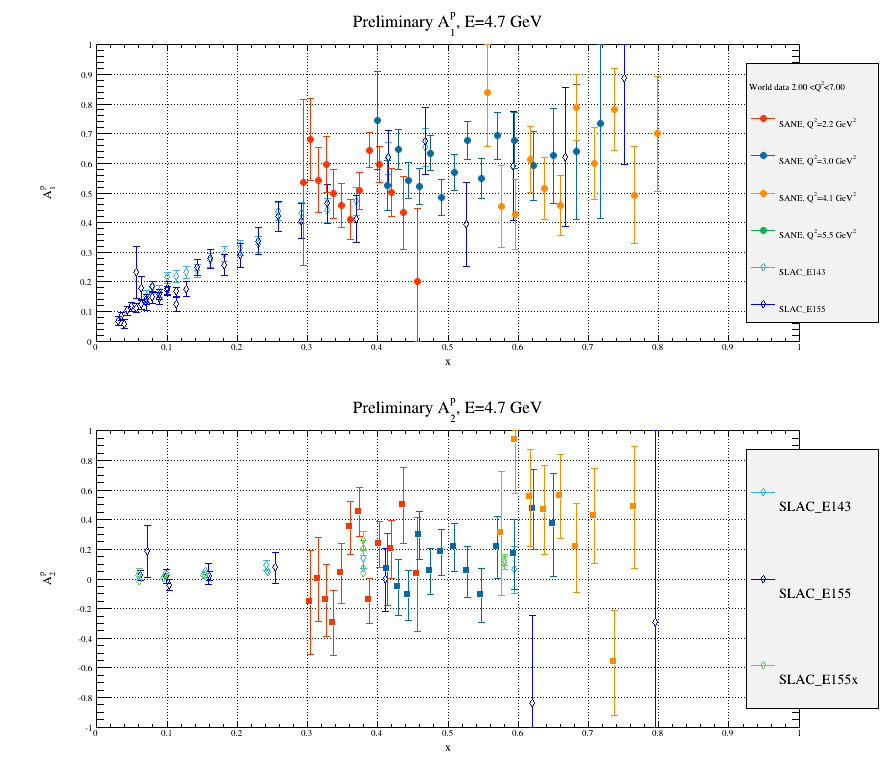
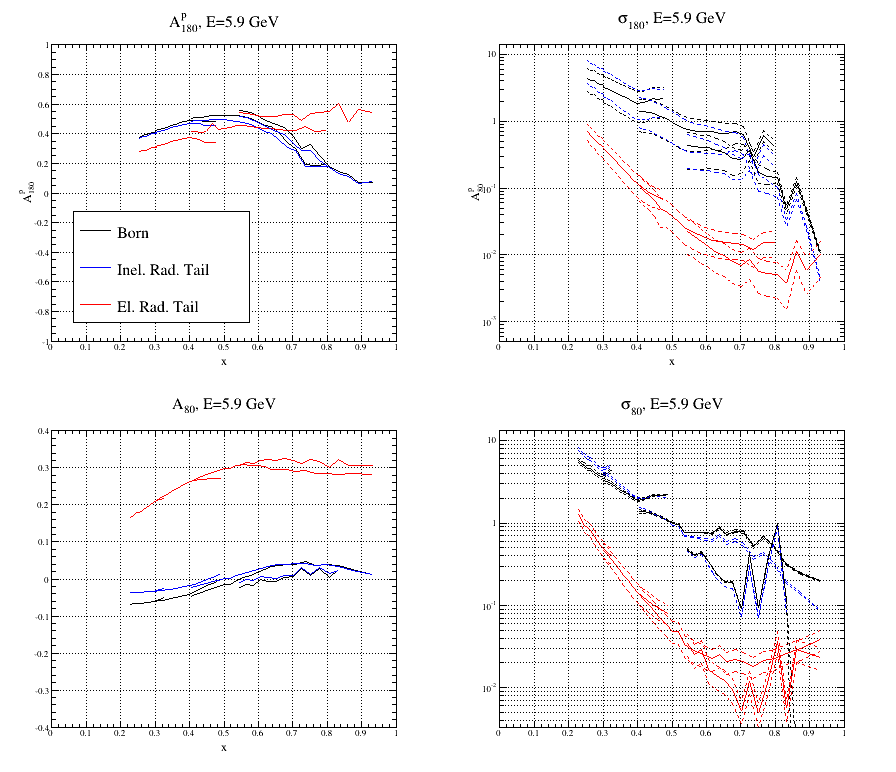
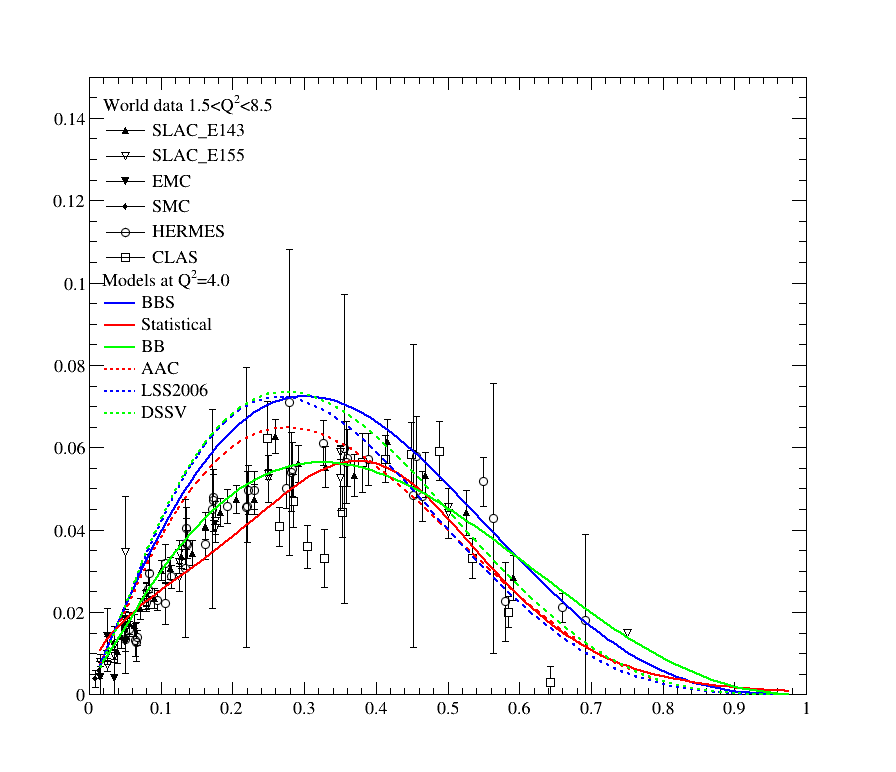
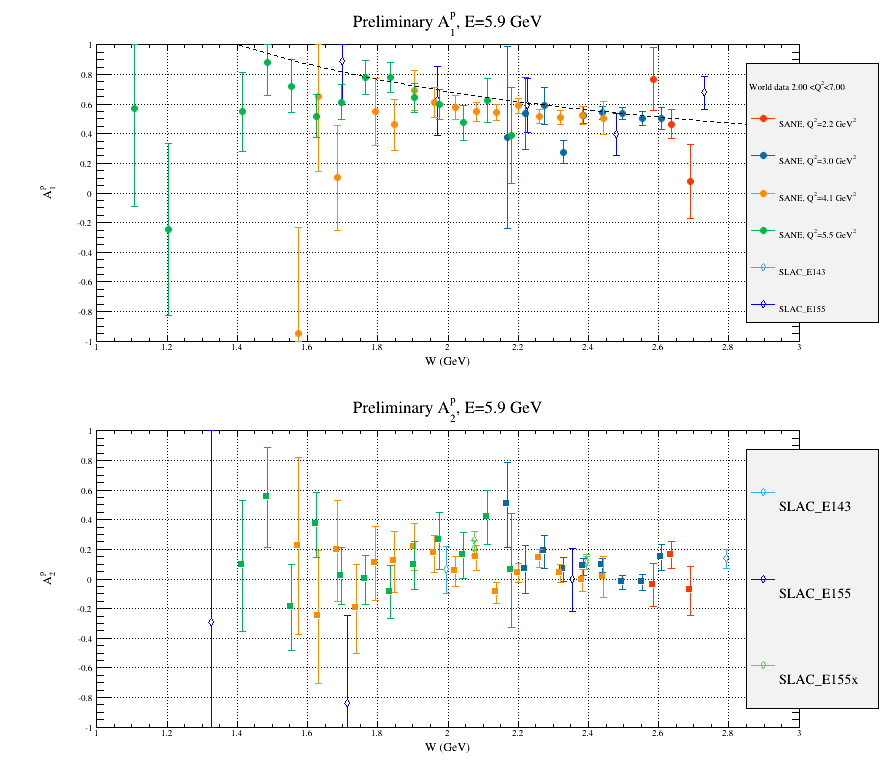
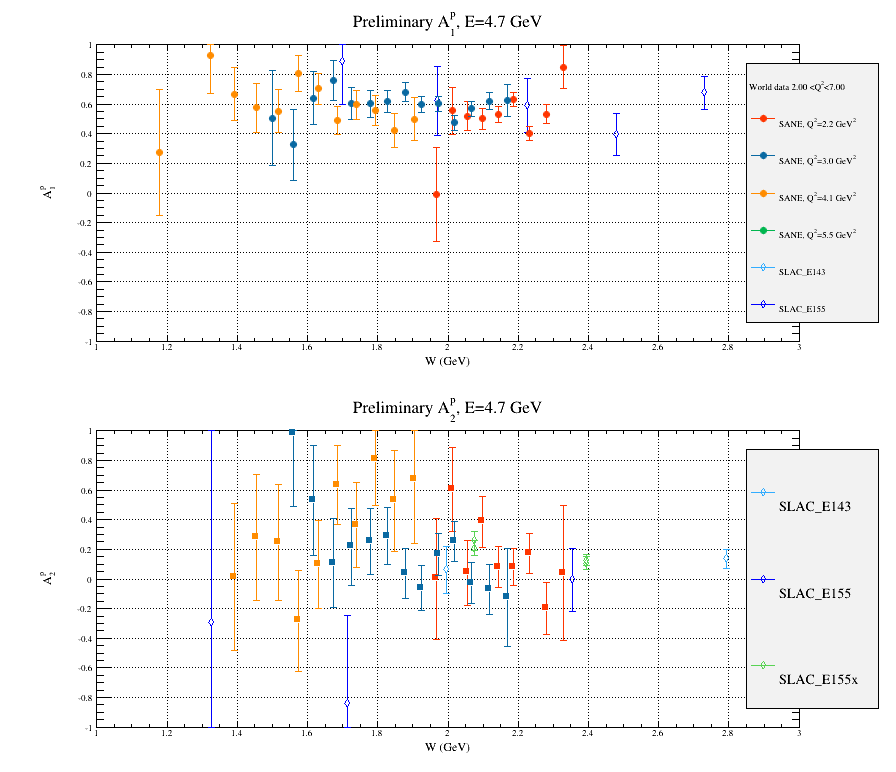
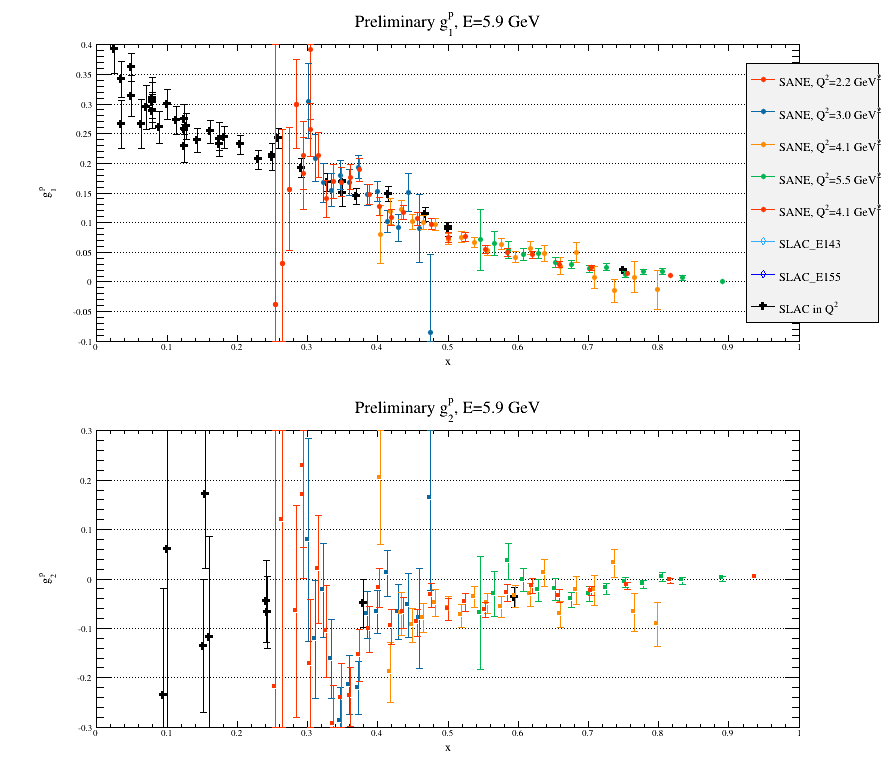
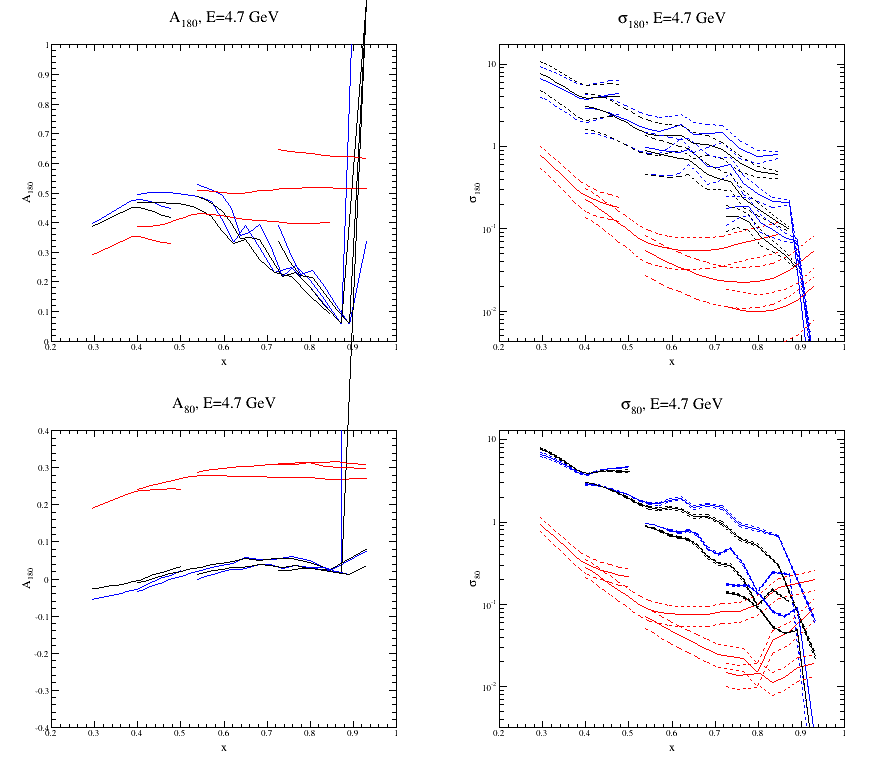
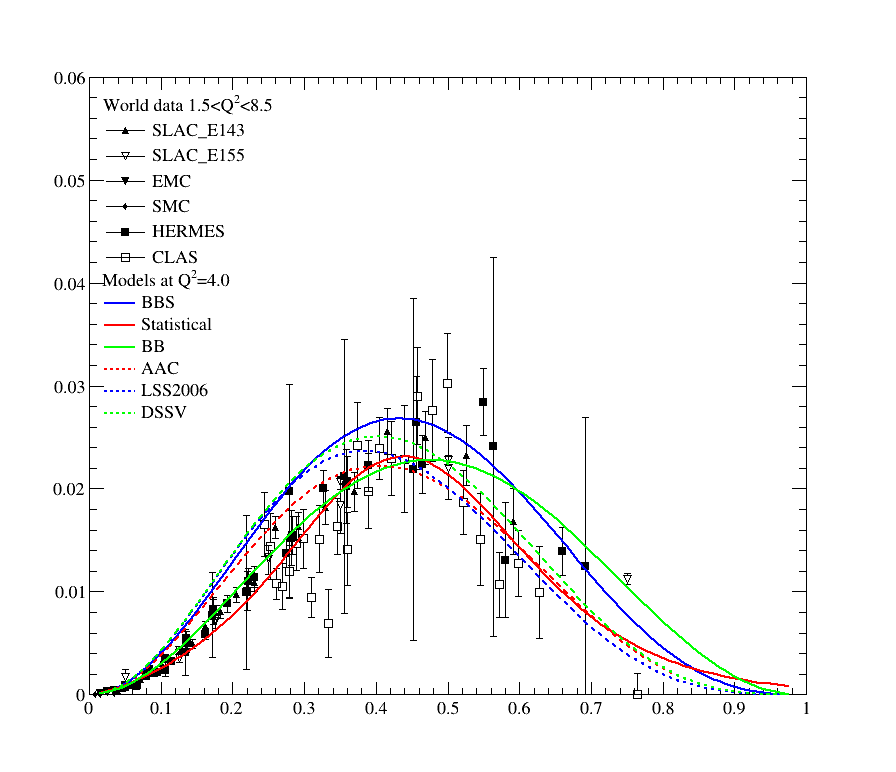
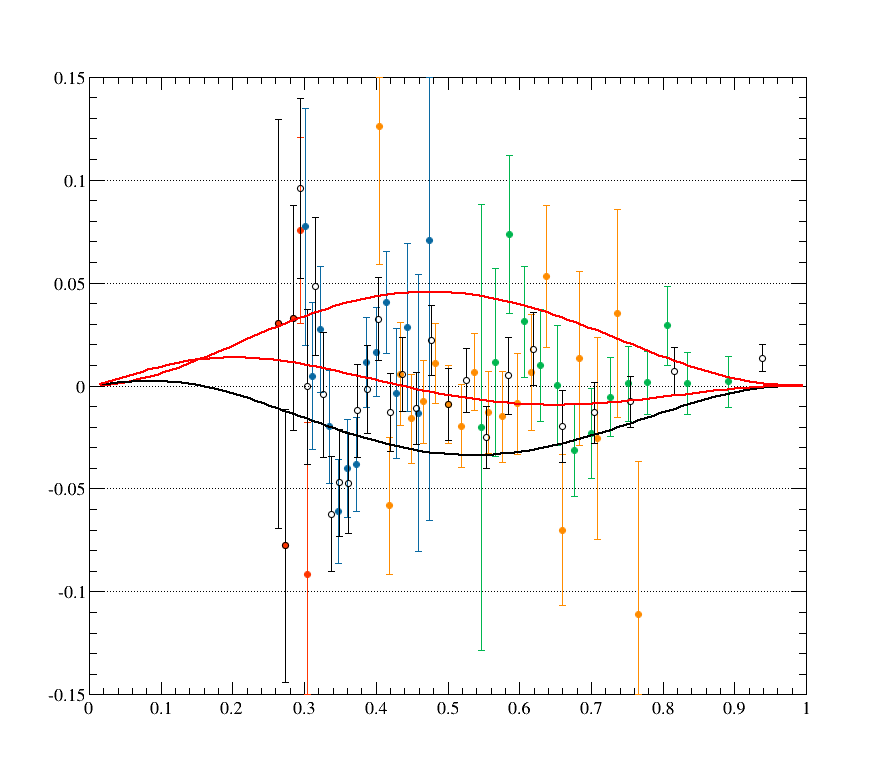
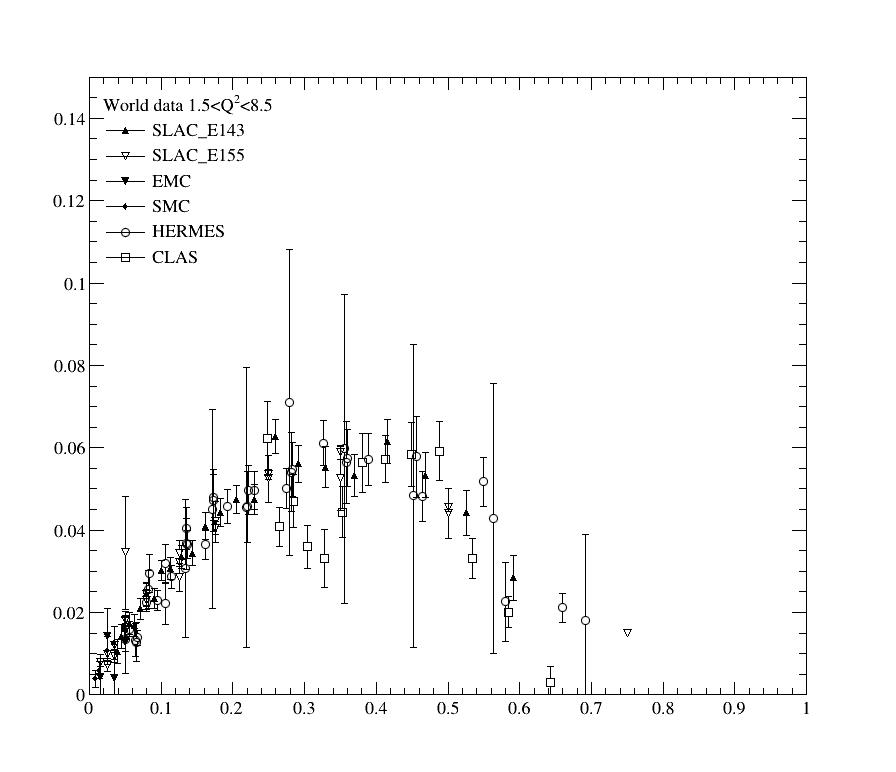
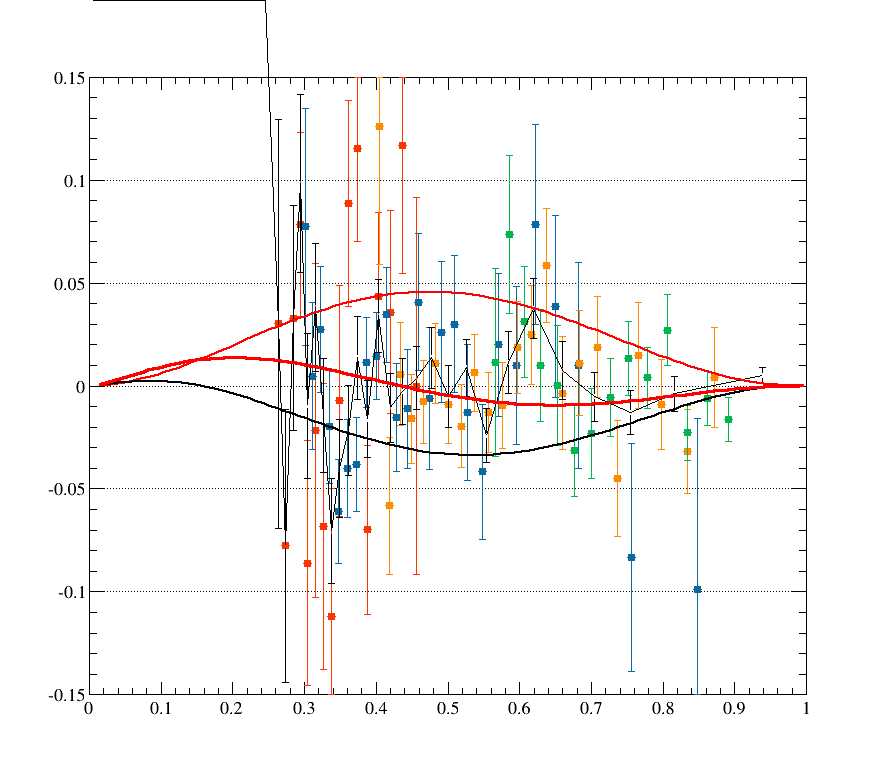
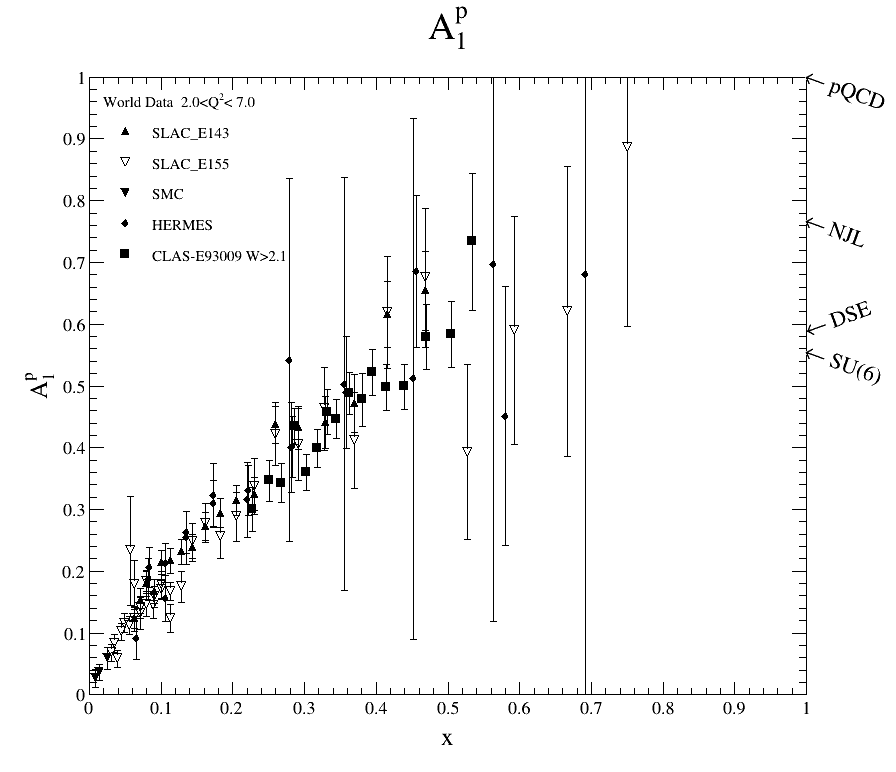
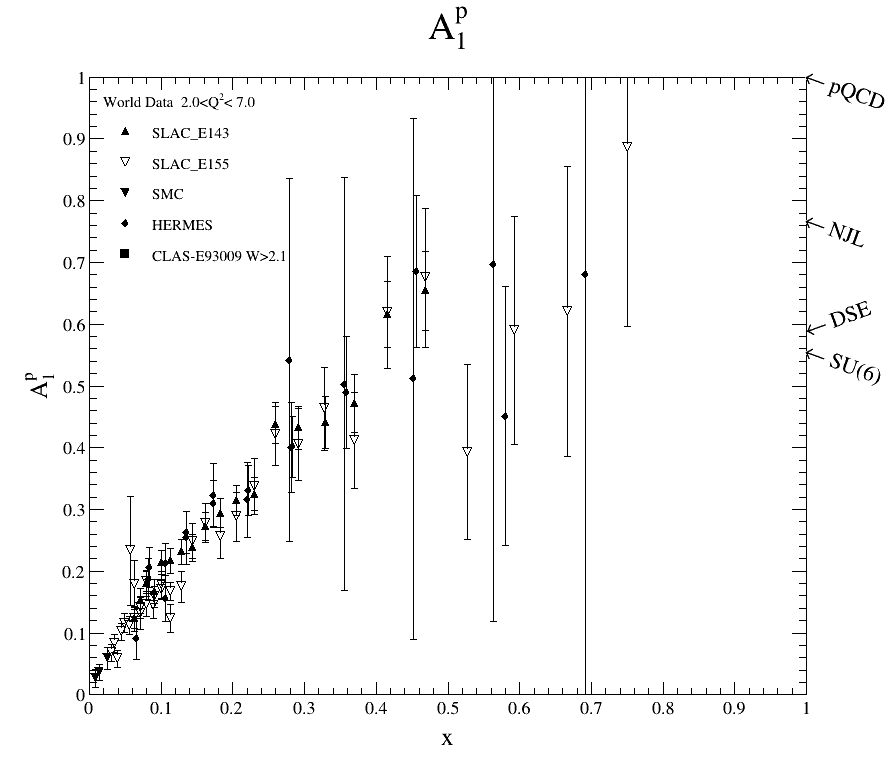
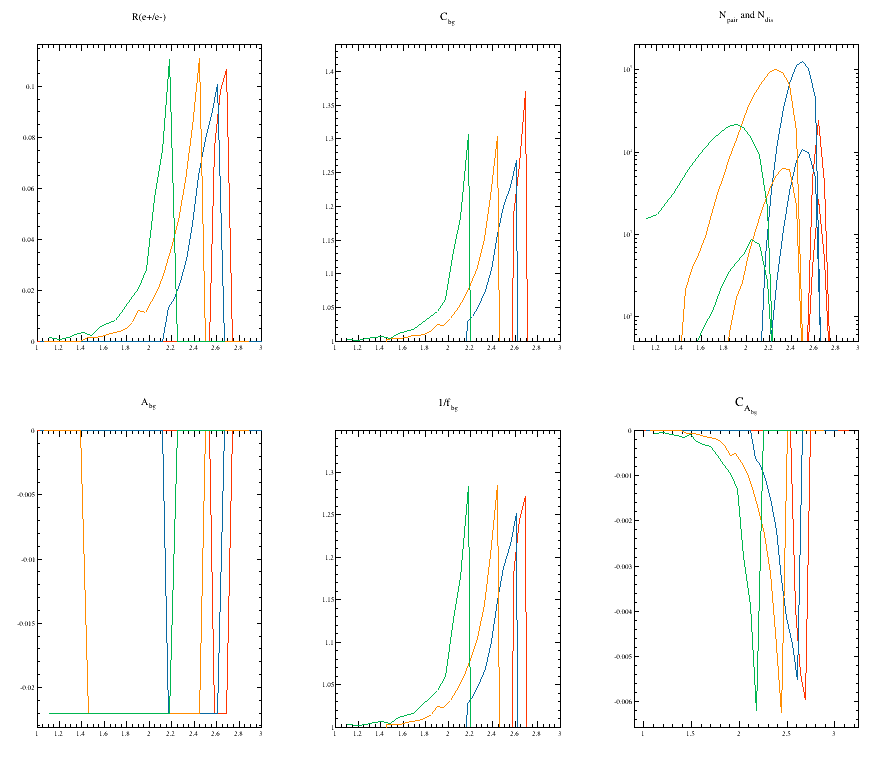
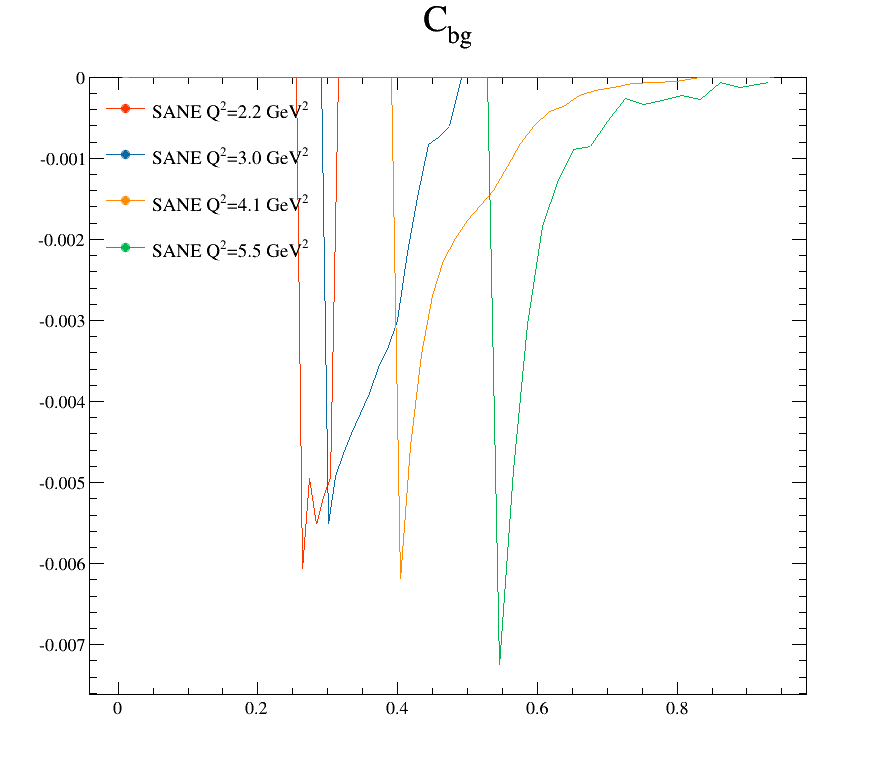
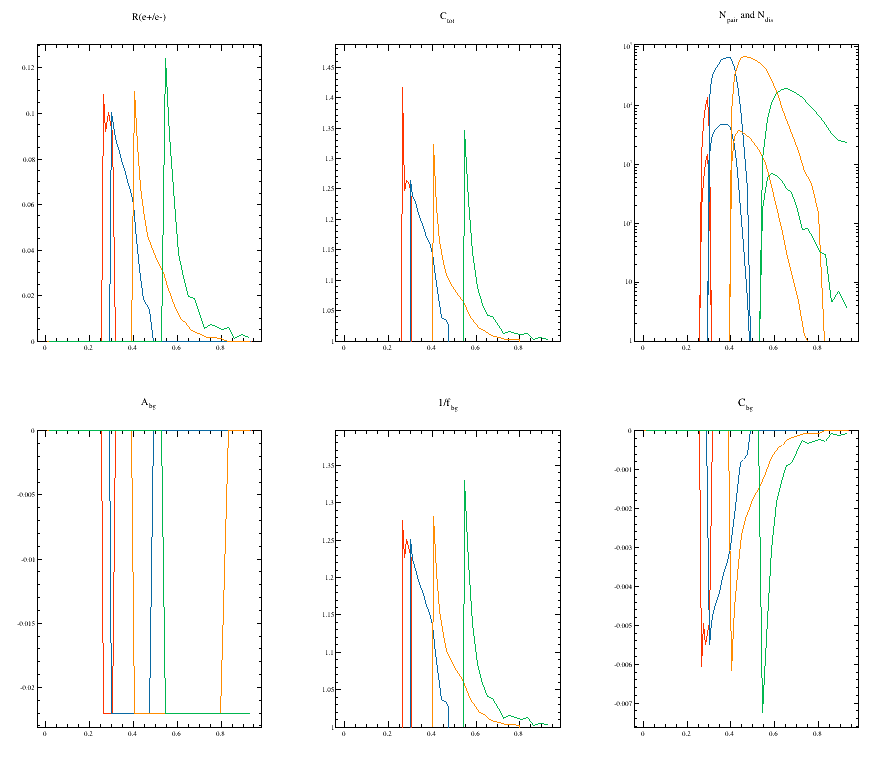
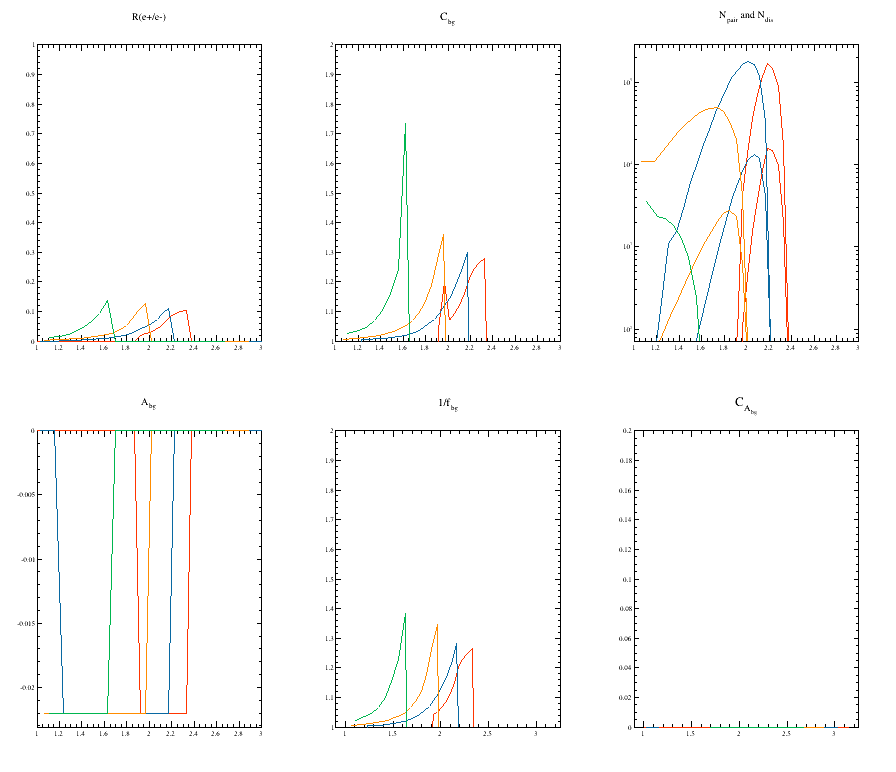
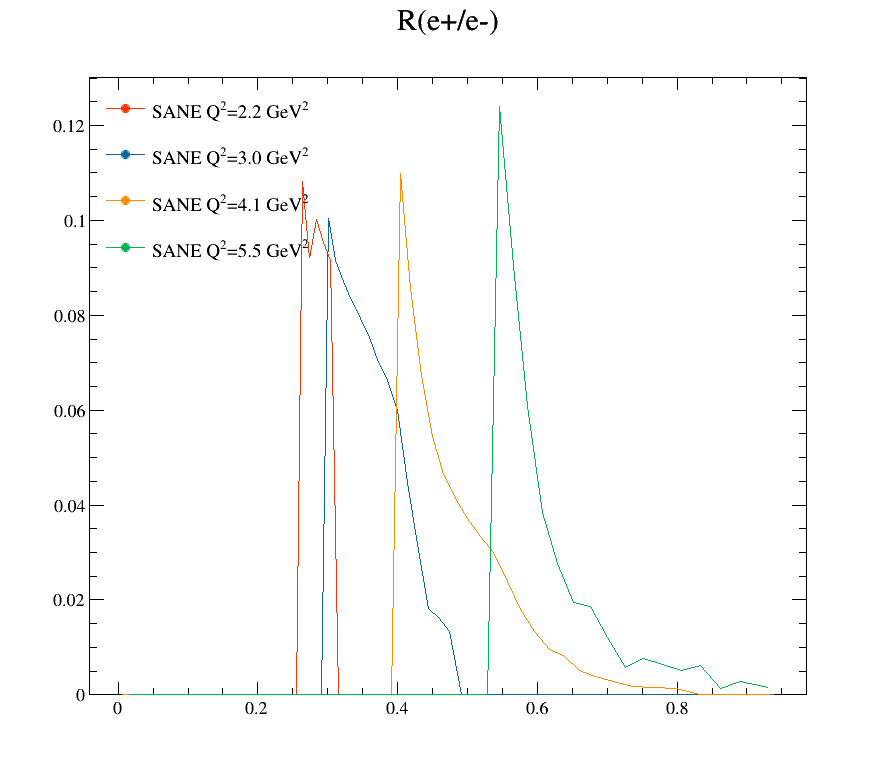
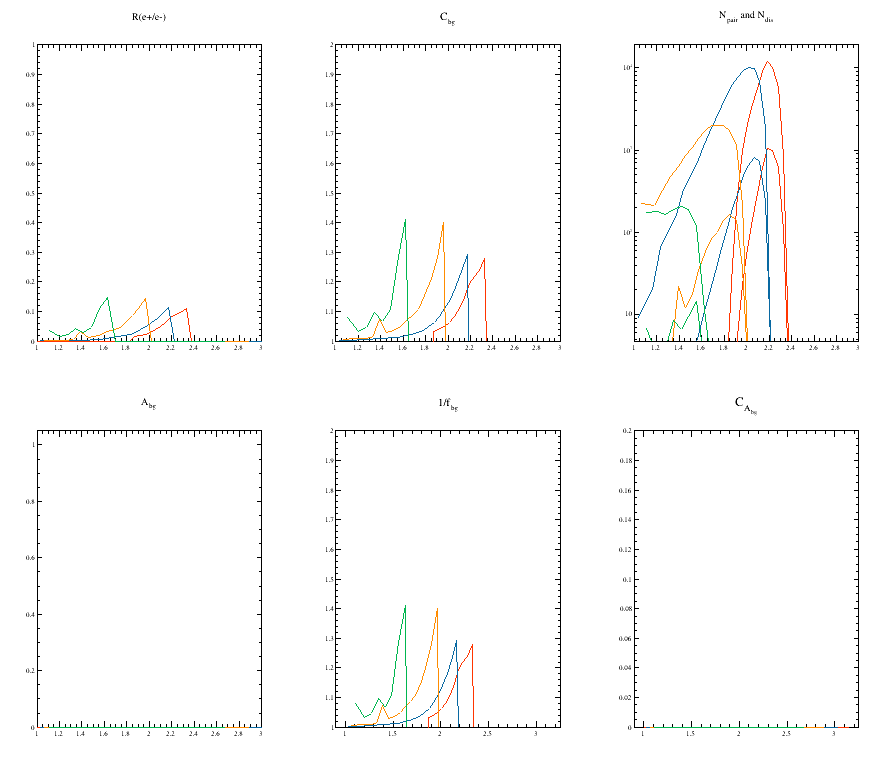
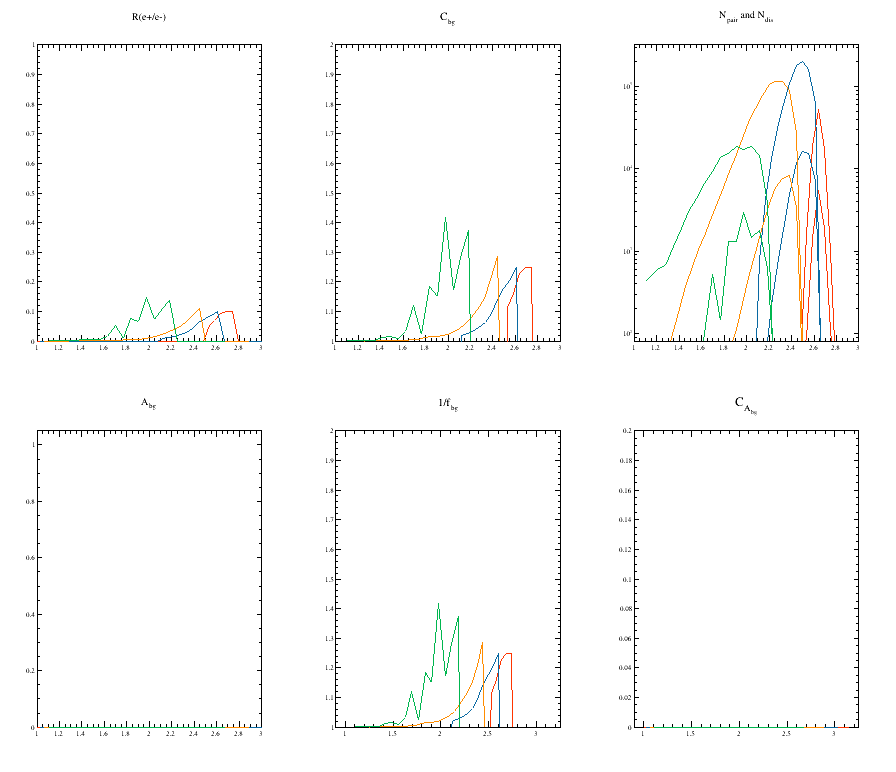
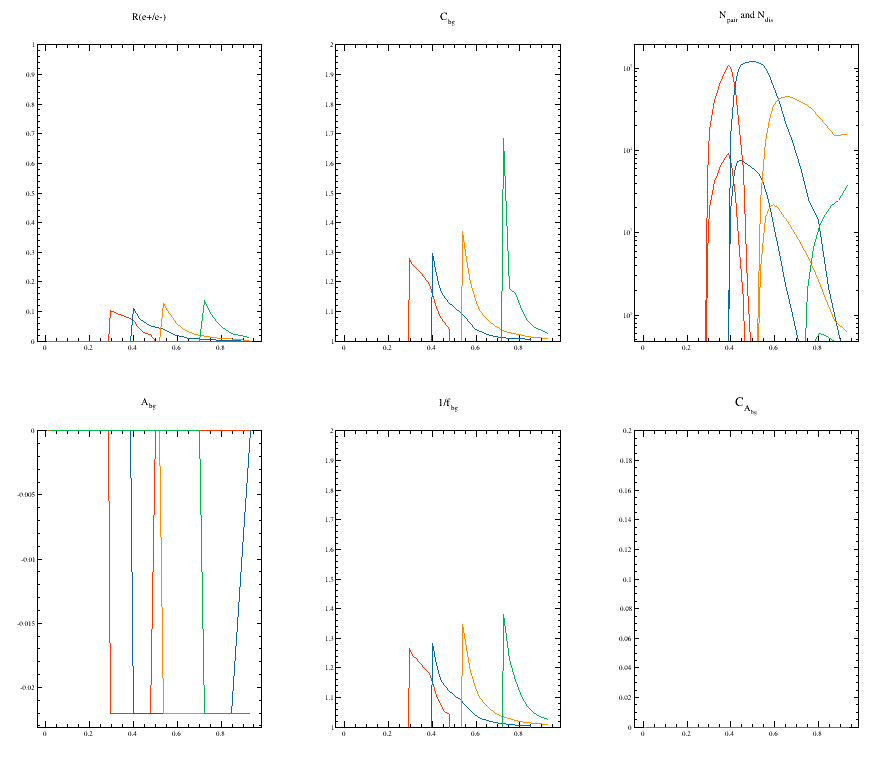
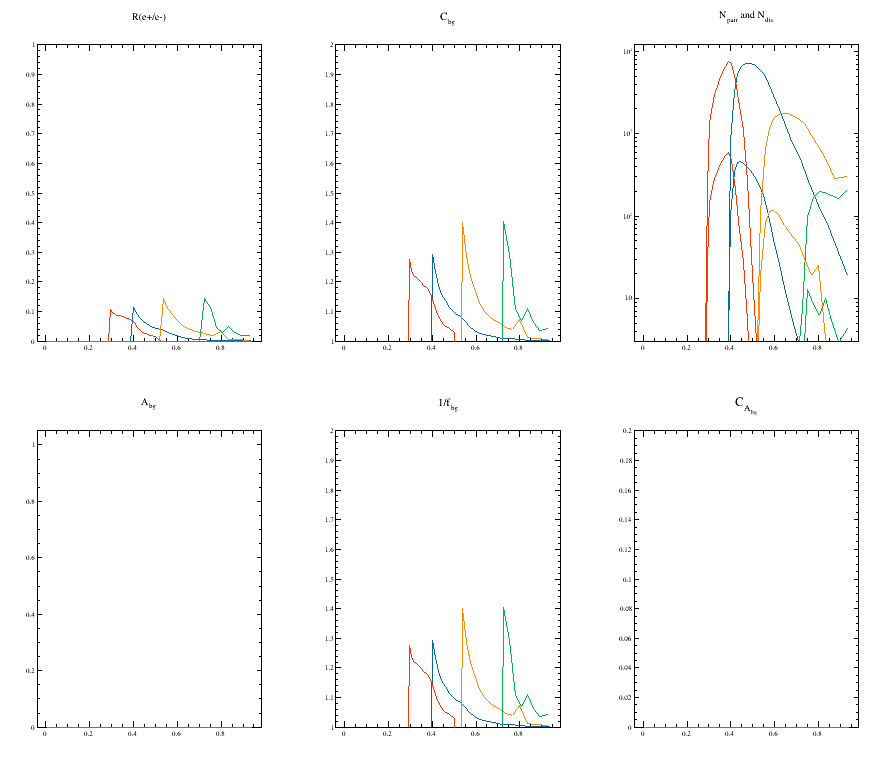
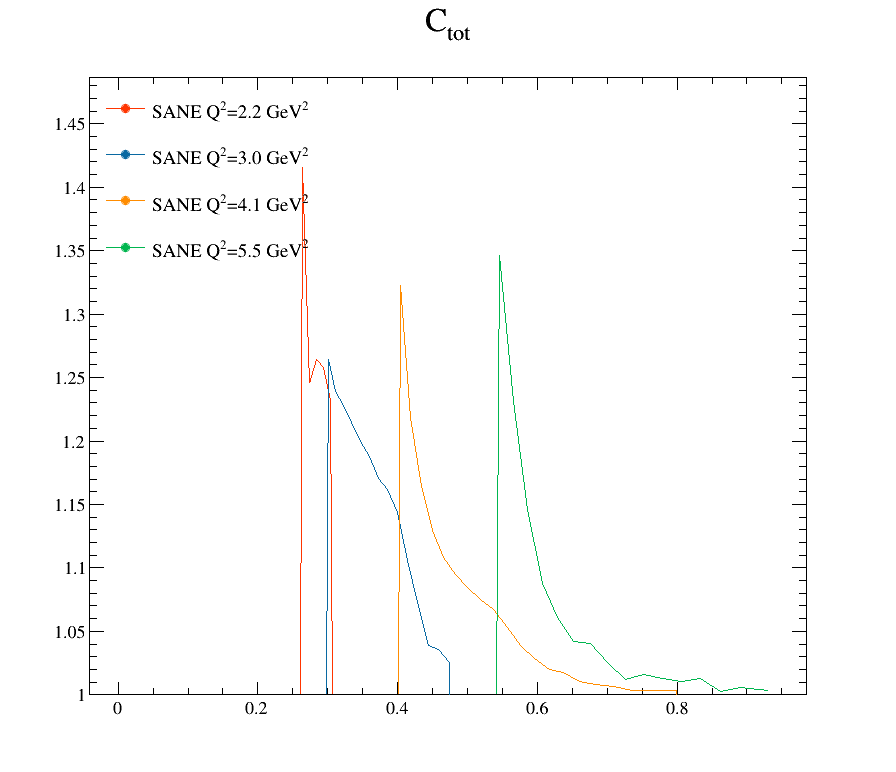
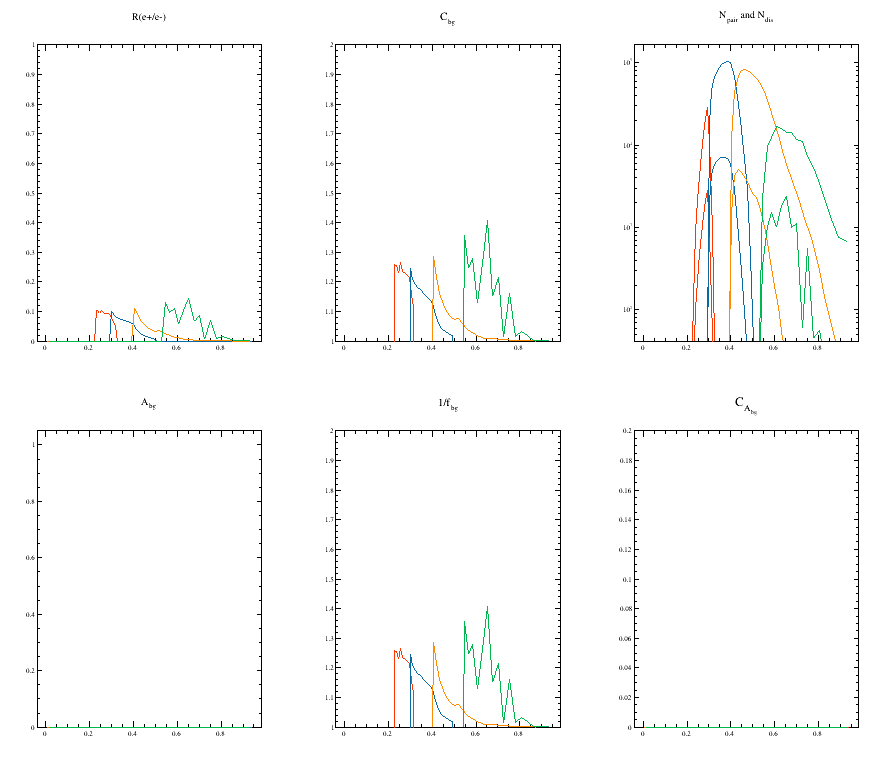
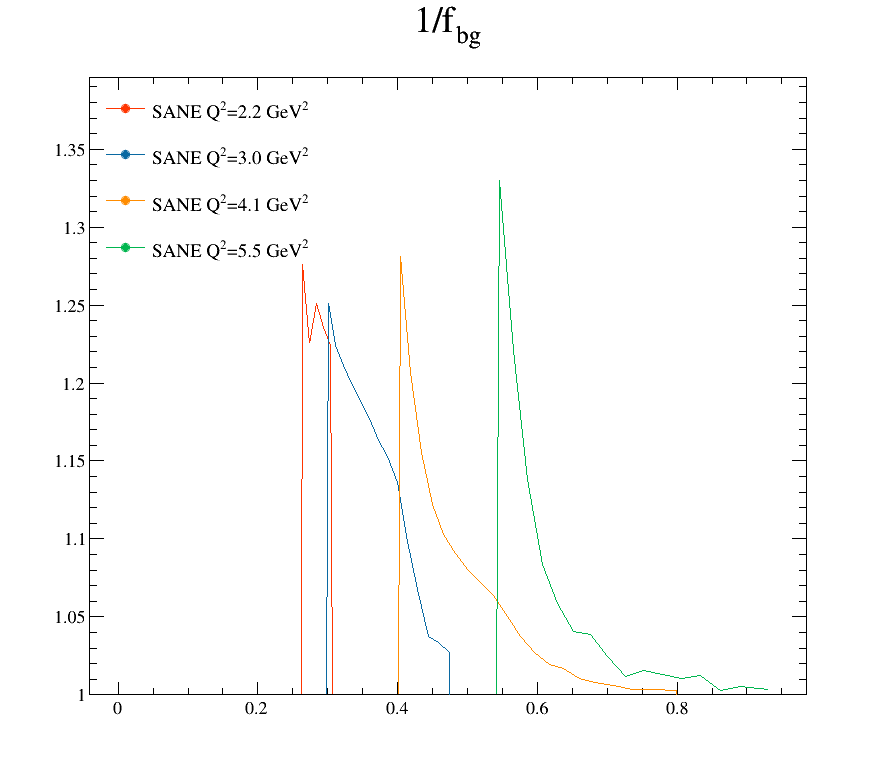
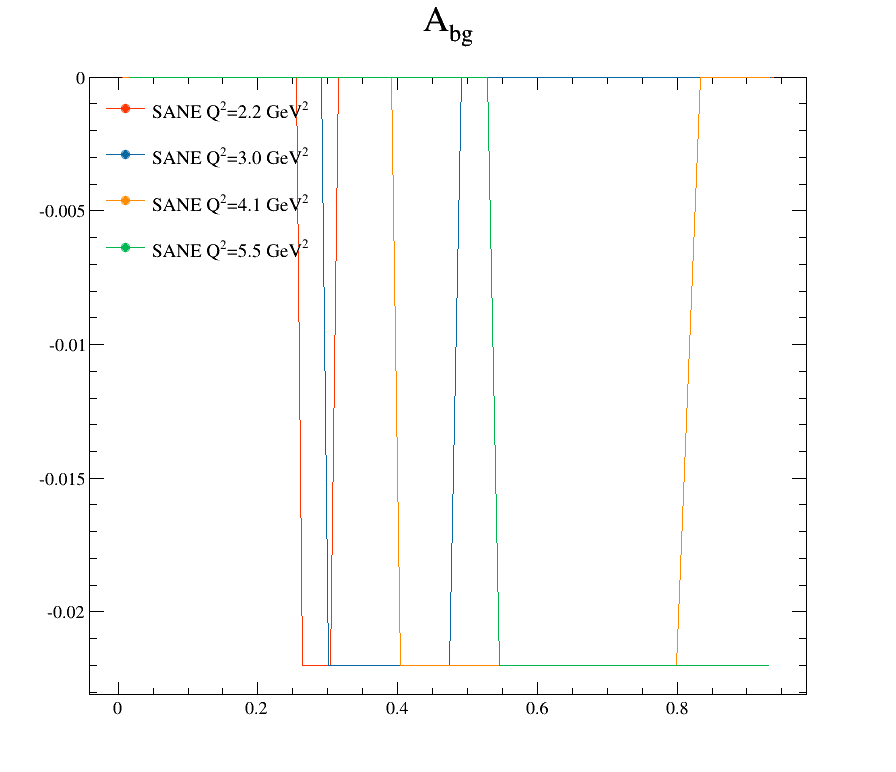
Below you will find updated plots using the new charge and livetime calculations.